Automating Cell Line Development for Biologics
1Beckman Coulter Life Sciences, Indianapolis, IN 2Molecular Devices, Sunnyvale, CA 3Pall ForteBio, Fremont, CA
ABSTRACT
Cell line development is a highly-involved, multi-week workflow that involves the plating, screening, and expansion of single cell-derived clones to establish a proteinexpression cell line. This complex process required significant throughput of sterile cell manipulations, long-term incubations, centrifugation, cell counting, monoclonality determination and growth tracking, and protein production assessment. Automating the cell line development process on the Biomek i7 Automated Workstation enabled us to meet the throughput needed for the workflow while minimizing the manual errors that lead to costly rework. Assay data from multiple instruments and time points were used as toll gates to identify the wells that met the criteria to continue through the lengthy process and these data ultimately drove automated hit-picking and cell expansion. Further improvements on workflow efficiency and sample and data integrity can be gained by integrating the various analyzers to the liquid handler and scheduling overlapping campaigns to maximize system utilization.
AUTOMATED CELL LINE DEVELOPMENT
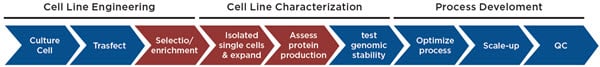
Figure 1. Cell Line Development Workflow. The cell line development process begins with transfecting cells (e.g. CHO) with a construct expressing your protein or antibody of interest, followed by removal of untransfected cells through growth in selective media and/or enriching for high expressing cells through cell sorting or colony picking. Here we focus on automating the enrichment of expressing cells and the generation and characterization of single cell-derived populations for maximizing protein production.

Figure 2. Biomek i7 Workstation. All cell manipulations and sample preparations were performed on a Biomek i7 Workstation with Span-8 pipettors and a 1200μL capacity 96-channel head. A HEPA-filtered enclosure and sterile filtered tips were utilized to maintain cell sterility. The Biomek was integrated with a Cytomat 2C incubator (right), a microplate centrifuge (not shown), and a Vi-CELL XR Cell Viability analyzer (not shown). Cell imaging and protein quantification were performed offline.
ENRICHMENT OF EXPRESSING CELLS

Figure 3. Semi-Solid Media Automation. To enrich the population of cells secreting IgG prior to clonal expansion, CHO cells were counted on an integrated Vi-CELL XR and 1,800 cells were dispensed to 22mL semi-solid CloneMedia CHO Growth A medium containing a 1:100 dilution of CloneDetect reagent (Molecular Devices). Using fine pipetting control, cells were slowly resuspended in the media and 3mL/well (250 cells) were dispensed to 6-well plates without introducing bubbles (A). Plates were incubated for 12 days to form colonies, then analyzed and picked using the ClonePix 2 (Molecular Devices, B).

Figure 4. Picking IgG-Secreting Colonies. A) Images of the 6-well plates were taken in brightfield and FITC channels with the ClonePix 2. B) Colonies that were secreting IgG showed a halo of fluorescence as IgG molecules aggregated near the colony within the semi-solid media and were stained by the CloneDetect reagent. C) Based on characteristics such as colony size, shape, and external FITC intensity, a subset of colonies were picked into 96-well plates containing 200μL of XP CHO Growth A medium for further culture, analysis, and monoclonal colony formation.
ISOLATE SINGLE CELLS & EXPAND

Figure 5. Automated Limiting Dilution. To create single-cell colonies, suspension CHO cells were mixed and dispensed to an integrated Vi-CELL XR Cell Viability Analyzer for counting. 100,000 cells were then stained with 0.25μM calcein AM at 37°C for 30 min. Following an initial 25-fold dilution, ~467 cells were added to 140mL XP CHO Growth A medium (Molecular Devices) such that there was one cell per 300μL on average. Robust mixing and rapid plate filling were achieved through the ability to aspirate and dispense 96mL at one time with the 1200μL-capacity multichannel head. Plates were spun in the integrated microplate centrifuge at 200×g for 4 min to ensure all cells were at the plate bottom prior to imaging on the CloneSelect Imager (B).
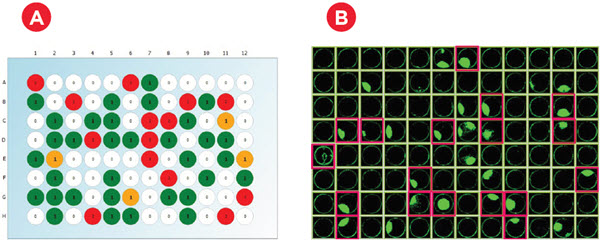
Figure 6. Monoclonality and Colony Growth. A) Immediately after plating, wells were imaged in brightfield and fluorescent channels to count calcein-stained cells. As expected with a limiting dilution approach, an average of 33% of wells had a single cell across six experiments (representative plate shown). B) Cell confluence was assessed at multiple time points for three weeks. Cell-conditioned media was able to achieve growth in roughly 50% of the monoclonal wells (pink highlights), resulting in ~16% of the plated wells being eligible for IgG production assessment.
ASSESS PROTEIN PRODUCTION

Figure 7. Hit Picking for IgG Analysis. Media from the ~16% of wells with colony growth from a single cell were sampled using the Span-8 pipettors and transferred to a 384-well tilted-bottom plate for analysis on the Octet HTX (Pall ForteBio, B). Protein A Dip and Read Biosensors were used to bind IgG for quantification.

Figure 8. IgG Quantification. A) Binding curves were generated from known Protein A standards (Pall ForteBio). B) Media from wells with clonal growth were assayed for IgG binding to Protein A biosensors. C) IgG concentration was determined for the clonal wells using the standard curve. Cells in high-expression wells (circled) were resuspended and transferred to larger-area 24-well plates for further expansion and analysis (e.g. genomic stability).
INTEGRATED WORKFLOW

Figure 9. Illustrative Integrated System. The devices described here can be integrated into a single workstation that reduces human intervention and thereby saves time and lowers the opportunity for errors. In addition, data from the various analyzers can be directly utilized to drive downstream steps such as hit picking, without the need for manual data transfers or manipulations. By integrating the devices, both sample and data integrity are improved throughout the lengthy workflow. Finally, software tools that track the labware locations and device capacities can maximize the utilization of
the system by enabling the overlap of campaigns as plate throughput allows.
CONCLUSIONS
- Automation can overcome many cell line development challenges including:
- Sample sterility
- Consistent pipetting of semi-solid media
- High-throughput limiting dilution
- Hit picking for IgG analysis
- Integrating devices can enable:
- Cell counting for in-process calculations of transfer volumes
- Centrifugation of cells for immediate monoclonality determination
- Sample and data integrity across multiple analyzers over multiple weeks
Helpful Links
-
資料集
-
アプリケーションノート
- フローサイトメトリーによる簡単な17 マーカー、 18カラーのヒト血液フェノタイピング
- 21 CFR Part 11 Data Integrity for On-line WFI Instruments
- 8011+ Reporting Standards Feature and Synopsis
- 気中浮遊粒子のモニタリング:ISO21501-4校正のインパクト
- Automated Cord Blood Cell Viability and Concentration Measurements Using the Vi‑CELL XR
- Biomek Automated NGS Solutions Accelerate Genomic Research
- Biomek i-Series Automation of the Beckman Coulter GenFind V3 Blood and Serum DNA Isolation Kit
- 超遠心機および自動分注装置を用いた カーボンナノチューブの調製・精製と 分析用超遠心システムによる解析
- Viability Assessment of Cell Cultures Using the CytoFLEX
- MET ONE HHPC 6+を用いた小型クリーンルームの空気清浄度クラス分類
- ハンドヘルド型気中パーティクルカウンターで行う クリーンキャビネットの定期的な評価
- Recommended cleaning procedure for the exterior surface of the MET ONE 3400+
- Counting Efficiency: MET ONE Air Particle Counters and Compliance to ISO-21501
- Critical Particle Size Distribution for Cement using Laser Diffraction
- Detecting and counting bacteria with the CytoFLEX research flow cytometer: II-Characterization of a variety of gram-positive bacteria
- 沈殿および遠心分離を組み合わせたキットを使用しない効率的な核酸分離法
- Echo System-Enhanced SMART-Seq v2 for RNA Sequencing
- 遠心機によるナノセルロースの分級
- 超遠心分離法 / 動的光散乱法による 顔料インクの分級と粒子径測定
- How to Use Violet Laser Side Scatter Detect Nanoparticle
- HIAC(ハイアック)システムでHRLDセンサーを使用する際の推奨ターボリューム設定
- Particle Size Analysis Simple, Effective and Precise
- Flow Cytometric Analysis of auto-fluorescent cells found in the marine demosponge Clathria prolifera
- MET ONE センサーの過酸化水素ガス(VHP)耐性
- 超遠心分離法による 金属コロイド精製と濃縮
- 密度勾配遠心法による 金ナノロッドの分離精製
- Miniaturized and High-Throughput Metabolic Stability Assay Enabled by the Echo Liquid Handler
- Minimal Sample to Sample Carry Over with the HIAC 8011+
- Modern Trends in Non‐Viable Particle Monitoring during Aseptic Processing
- ナノ粒子複合材の粒子径測定 - 密度勾配超遠心法と動的光散乱法を用いて -
- Identification of Circulating Myeloid Cell Populations in NLRP3 Null Mice
- Optimizing the HIAC 8011+ Particle Counter for Analyzing Viscous Fluids
- パーティクルカウンター資料集 高圧ガス配管内の清浄度測定- MET ONE 3400ガス校正オプションで ISO 14644の計測を簡単に -
- 無菌医薬品製造区域の環境モニタリング
- 無菌医薬品製造のためのペーパーレスによる環境モニタリング
- Analysis of plant genome sizes using flow cytometry: a case study demonstrating dynamic range and measurement linearity
- Calibrating the QbD1200 TOC Analyzer
- Detection Limit
- Vibrio Natriegens Process Scale-up
- モノクローナル抗体産生CHO 細胞株の96-ウェルプレートを用いたフェドバッチ培養条件最適化の自動化
- A Deeper Look at Lipid Nanoparticles
- A High-Throughput, Automated Screening Platform for IgG Quantification During Drug Discovery and Development
- Automated Research Flow Cytometry Workflow Using DURA Innovations Dry Reagent Technology with the *Biomek i7 Automated Workstation and *CytoFLEX LX Flow Cytometer
- Automating antibody titration using a CytoFLEX LX analyzer Integrated with a Biomek i7 Multichannel workstation and Cytobank streamlined data analysis
- Automated IDT Alt-R CRISPR/Cas9 Ribonucleoprotein Lipofection Using the Biomek i7 Hybrid Automated Workstation
- Monitoring Yeast Cultures with the BioLector and Multisizer 4e instruments
- Cultivation of suspended plant cells in the BioLector®
- Determination of cell death in the BioLector Microbioreactor
- Echo System-Enhanced SMART-Seq v4 for RNA Sequencing
- 環境モニタリングに最適なハンドヘルドパーティクルカウンターを選ぶためのシンプルガイド
- Linearity of the Vi-CELL BLU Cell Counter and Analyzer
- Miniaturized 16S rRNA Amplicon Sequencing with the Echo 525 Liquid Handler for Metagenomic and Microbiome Studies
- マイクロバイオリアクターBioLector XTおよび 微生物径・体積分布測定装置Multisizer 4eによる異なる培養培地でのシアノバクテリアSynechocystisのモニタリング
- mRNA Manufacturing with Fed Batch In Vitro Transcription
- Nanoliter Scale High-Throughput Protein Crystallography Screening with the Echo Liquid Handler
- Optimizing EV Analysis with a CytoFLEX nano flow cytometer and FCMPASS
- Preparation of Mouse Plasma Microsamples for LC-MS/MS Analysis Using the Echo Liquid Handler
- Robust and High-Throughput SARS-CoV-2 Viral RNA Detection, Research, and Sequencing Using RNAdvance Viral and the OT-2 Platform
- The Valita Aggregation Pure assay: A rapid and accurate alternative for aggregation quantification of purified monoclonal antibodies
- フローサイトメトリーを用いた海洋サンプル中植物プランクトンの正確な計数
- ファインバブルのサイズと粒子数を正確に測定
- Achieving Compliant Batch Release – Sterile Parenteral Quality Control
- Adaptive Laboratory Evolution of Pseudomonas putida in the RoboLector
- Adjustment of the pH control settings in the BioLector Pro microbioreactor
- Aerobic cultivation of high-oxygen-demanding microorganisms in the BioLector XT microbioreactor
- CytoFLEX mosaicシステムを用いたコンベンショナル検出とスペクトル検出の比較:DURAClone IM T細胞サブセット抗体パネルでのケース
- 分析における革命:次世代を担うOptima AUCの概要
- スペクトル検出モジュールCytoFLEX mosaic を用いて複数の自家蛍光を除去することによる、白血球ポピュレーションのスペクトルアンミキシングの向上
- OMIP-104 食事誘発性肥満マウスの肝臓組織免疫細胞構成の検討:公開されているOMIP パネルのスペクトルフローサイトメーター CytoFLEX mosaic システムへの適用
- Multisizer 4eを用いた二枚貝の育成繁殖のための分析
- Assay Assembly for Miniaturized Quantitative PCR in a 384-well Format Using the Echo Liquid Handler
- Automated 3D Cell Culture and Screening by Imaging and Flow Cytometry
- Automating a Linear Density Gradient for Purification of a Protein:Ligand Complex
- Automating Biopharma Quality Control to Reduce Costs and Improve Data Integrity
- Automating Bradford Assays
- 細胞培養プロセスの自動化
- 自動化システム活用による細胞株開発(CLD)における課題の克服
- BioLector マイクロバイオリアクターを使ったプロバイオティクス細菌の嫌気培養プロセス
- NGSワークフローの自動化比較:NGSライブラリ自動調製システム Biomek NGeniuSと従来型自動分注機 *
- Automation of CyQuant LDH Cytotoxicity Assay using Biomek i7 Hybrid Automated Workstation to Monitor Cell Health
- NGS ライブラリ自動調製システム Biomek NGeniuS を用いた Illumina DNA Prep Kit の自動化
- Automation of protein A ELISA Assays using Biomek i7 hybrid workstation
- 新機種Avanti J-15遠心機におけるサンプル保護の改善およびサンプル回収率の最大化
- 新機種Avanti J-15遠心機の短時間減速プロファイルによるワークフロー効率の向上
- タンパク質精製-すべてのステップをこの1台で!-
- バイオ医薬品の品質管理を目的として細胞カウントを自動化する際の注意点
- 今さら聞けない マルチカラーフローサイトメトリーのコツ
- Beer, Evaluation of Final Product and Filtration Efficiency
- Monitoring E. coli Cultures with the BioLector and Multisizer 4e Instruments
- BiomekによるゲノムDNAライブラリ調製の自動化がもたらす研究の加速
- Biomek i7 Hybrid Automated KAPA mRNA HyperPrep Workflow
- Biomek i-Series Automated AmpliSeq for Illumina® Library Prep Kit
- Biomek i-Series Automated Beckman Coulter Agencourt RNAdvance Blood Kit
- Biomek i-Series Automated Beckman Coulter Agencourt RNAdvance Cell
- Biomek i-Series Automated Beckman Coulter Agencourt SPRIselect for DNA Size Selection
- Biomek i-Series Automated IDT® xGen Hybridization Capture of DNA libraries on Biomek i7 Hybrid Genomics Workstation
- Biomek i-Series Automated Illumina Nextera DNA Flex Library Prep Kit
- Biomek i-Series Automated Illumina® Nextera XT DNA Library Prep Kit
- Biomek i-Series Automated Illumina TruSeq DNA PCR-Free Library Prep Kit
- Biomek i-Series Automated Illumina TruSeq® Nano DNA Library Prep Kit
- Biomek i-Series Automated Illumina TruSeq® Stranded mRNA Sample Preparation Kit Protocol
- Biomek i-Series Automated Illumina TruSeq® Stranded Total RNA Sample Preparation Kit Protocol
- Biomek i–Series Automated Illumina® TruSight Tumor 170 32 Sample Method
- Biomek i-Series Automated KAPA HyperPrep and HyperPlus Workflows
- Biomek i-Series Automated New England Biolabs NEBNext® Ultra II DNA Library Prep Kit
- Biomek i-Series Automated SurePlex PCR and VeriSeq PGS Library Prep for Illumina
- Biomek i-Series Automation of the DNAdvance Genomic DNA Isolation Kit
- 生死細胞オートアナライザーVi–CELL BLUの計数性能評価
- Cell Line Development – Data Handling
- Cell Line Development – Limiting Dilution
- バイオ医薬品の細胞株開発に向けたモノクローンの選別とエンリッチメント
- コールター原理を用いた細胞計数
- Changes to GMP Force Cleanroom Re-Classifications
- 超遠心分析を用いたバイオ医薬品インスリンのキャラクタリゼーション
- 気中パーティクルカウンター MET ONE 3400+のFDA 21CFR Part11 コンプライアンスガイド
- 生死細胞オートアナライザーVi-CELL BLUを用いたクラスタ計数解析と、サンプル調製方法についての検討
- Comparing Data Quality & Optical Resolution of the Next Generation Optima AUC to the Proven ProteomeLab on a Model Protein System
- MET ONE 3400によるISO14644-3に基づいたクリーンルーム回復性能試験の実施
- 96ウェルプレートを利用して細胞の計数条件を決める有効な方法
- Consistent Cell Maintenance and Plating through Automation
- スフェロイドのサイズのコントロールと製品化へのサポート
- Control Standards and Method Recommendations for the LS 13 320 XR
- 医薬・製薬業界で求められるデータインテグリティと気中パーティクルカウンターMET ONE 3400+の機能
- Cydem VT Automated Clone Screening System – Generating an Antibody Standard Curve
- Cydem VT System: A Comparison to Traditional Clone Screening Platforms
- Cydem VT System Analytical Capabilities and Repeatability
- Determination of kLa values on the Cydem VT Automated Clone Screening System
- Optimize Clone Screening: Time Savings with the Cydem VT System in Monoclonal Antibody-Producing Cell Line Development Workflows
- Protein Titer Capabilities - A Comparison of the Cydem VT System to Current Technology across Various CHO Media
- Vi-CELL BLU Analyzer Data Exports and Offline Analysis Instructions
- フローサイトメトリーハイパラメータ(高次元)データでのマシンラーニングアルゴリズムを用いた解析・可視化 -CytoFLEX LX 20カラーパネルでの例-
- チャネル数の異なるFCSファイルをRで書き換える方法
- ナノフローサイトメーター CytoFLEX nano が実現する、ナノ粒子解析の新アプローチ
- ナノフローサイトメーターCytoFLEX nano:ナノスケール・フローサイトメトリーの新境地
- Detecting Moisture in Hydraulic Fluid, Oil and Fuels
- 半導体封止材のクラックを引き起こすシリカ中の粗大粒子の検出
- Multisizer 4eを用いたメッキ液中の異物検出
- コールターカウンターを用いた薬剤耐性菌の測定
- Determination of Size and Concentration of Particles in Oils
- DO-controlled fed-batch cultivation in the RoboLector®
- dsDNA Quantification with the Echo 525 Liquid Handler for Miniaturized Reaction Volumes, Reduced Sample Input, and Cost Savings
- Screening of yeast-based nutrients for E. coli-based recombinant protein production using the RoboLector Platform
- E. coli fed-batch cultivation using the BioLector® Pro
- マルチプレックス全ゲノムシーケンシングおよびマイクロバイオームアプリケーションのためのIllumina Nextera XTライブラリ調製の効果的な微量化
- Efficient clone screening with increased process control and integrated cell health and titer measurements with the Cydem VT Automated Clone Screening System
- Efficient Factorial Optimization of Transfection Conditions
- ワクチン開発・製造を推し進める
- Enumeration And Size Distribution Of Yeast Cells In The Brewing Industry
- 生死細胞オートアナライザー Vi–CELL BLUの機器間差評価テスト
- Filling MicroClime Environmental Lids
- Flexible ELISA automation with the Biomek i5 Workstation
- 高速冷却遠心機に搭載の優れた"空気摩擦熱減少システム"
- Fully Automated Peptide Desalting for Liquid Chromatography–Tandem Mass Spectrometry Analysis Using Beckman Coulter Biomek i7 Hybrid Workstation
- Biomek i7ハイブリッド・加圧・遠心分離インテグレーションシステムによるビタミンD測定前処理の自動化
- Get Control in GMP Environments
- Getting Started with Kaluza: Data Scaling and Compensation Adjustment
- Getting Started with Kaluza: Parameters
- g-Max:ベックマン・コールターの多機能な超遠心用製品群への性能追加
- 超遠心法によりナノ粒子を分級して 正確な粒子径を求める方法
- DURACloneのコンペンセーション設定
- HIAC Industrial – Our overview solution for fluid power testing for all applications
- High throughput cultivation of the cellulolytic fungus Trichoderma reesei in the BioLector®
- High-Throughput qPCR and RT-qPCR Workflows Enabled by Echo Acoustic Liquid Handling and NEB Luna Reagents
- A Highly Consistent BCA Assay on Biomek i-Series
- A Highly Consistent Bradford Assay on Biomek i-Series
- A Highly Consistent Lowry Method on Biomek i-Series
- Highly Reproducible Automated Proteomics Sample Preparation on Biomek i-Series
- High-throughput IgG quantitation platform for clone screening during drug discovery and development
- High-throughput Miniaturization of Cytochrome P450 Time-dependent Inhibition Screening Using the Echo 525 Liquid Handler
- 細胞株開発におけるハイスピードでエラーを低減できるヒットピッキング自動化の実現
- Host Cell Residual DNA Testing in Reduced Volume qPCR Reactions Using Acoustic Liquid Handling
- ベックマン・コールターの遠心機を使用したエクソソーム除去FBSの作製:コスト効果に優れた堅実な選択肢
- フローサイトメーターCytoFLEXを用いた、バイオレットレーザーの側方散乱光を利用してナノ粒子を検出する方法
- 細胞株開発
- ICH Q2 – the Challenge of Measuring Total Organic Carbon in Modern Pharmaceutical Water Systems
- ICH Q2 – The Challenge of Measuring Total Organic Carbon in Modern Pharmaceutical Water Systems
- ICH Q2 – the Challenge of Measuring Total Organic Carbon in Modern Pharmaceutical Water Systems
- Illumina Nextera Flex for Enrichment on the Biomek i7 Hybrid Genomics Workstation
- Improved data quality of plate-based IgG quantification using Spark®’s enhanced optics
- Valita Titer 384ウェルプレートによるIgG定量スループットの向上
- Vi-CELL BLU 生死細胞自動セルカウンターとSartorius 社のAmbr® 250 ハイスループットバイオリアクターとの統合による細胞濃度および生存率の測定の自動化
- Temperature dependence of hydrodynamic radius of an intrinsically disordered protein measured in the Optima AUC analytical ultracentrifuge.
- Introducing the Cydem VT Automated Cell Culture System: A high-throughput platform for fast and reliable clone screening experiments
- Issues with Testing Jet Fuels for Contamination
- Jurkat Cell Analyses Using the Vi-CELL BLU Cell Viability Analyzer
- 細胞代謝活性モニタリングにおける Vi-CELL MetaFLEXの有用性
- Linearity of BSA Using Absorbance & Interference Optics
- 光学式パーティクルカウンターにおける「Long Life Lasers(長寿命レーザー)」の検証
- LS 13 320 XR: Sample Preparation - How to measure success
- Beckman’s LS 13 320 XR Vs. Malvern Mastersizer
- 20カラー イムノタイピングデータのマシンラーニング アルゴリズムを用いた細胞サブセットの詳細解析
- Vi–CELL XRとVi–CELL BLUの 計数マッチング方法
- Media optimization in the RoboLector platform for enhanced protein production using C. glutamicum
- MET ONE 3400+ LDAP & Active Directory connection Guide
- Vi-CELL BLUの計数値をVi-CELL XRに素早く一致させるための有効な方法
- フローサイトメーターCytoFLEX Sでデザインしたパネルの セルソーターCytoFLEX SRTへの移行方法
- Miniaturization of an Epigenetic AlphaLISA Assay with the Echo Liquid Handler and the BMG LABTECH PHERAstar FS
- Miniaturization and Rapid Processing of TXTL Reactions Using Acoustic Liquid Handling
- Miniaturized Enzo Life Sciences HDAC1 Fluor de Lys Assays Using an Echo Liquid Handler Integrated in an Access Laboratory Workstation
- Miniaturized Enzymatic Assays with Glycerol
- Miniaturized EPIgeneous HTRF Assays Using the Echo Liquid Handler
- Miniaturized Gene Expression in as Little as 250 nL
- Miniaturized Genotyping Reactions Using the Echo Liquid Handler
- Miniaturized Multi-Piece DNA Assembly Using the Echo 525 Liquid Handler
- Miniaturized Sequencing Workflows for Microbiome and Metagenomic Studies
- ミネラルウォーター製造工程のばらつき最小化
- CytoFLEX SRTセルソーターによる ミックスモードソーティング
- Mode of operation of optical sensors for dissolved oxygen and pH value
- Modular DNA Assembly of PIK3CA Using Acoustic Liquid Transfer in Nanoliter Volumes
- Multi-Wavelength Analytical Ultracentrifugation of Human Serum Albumin complexed with Porphyrin
- Nanoliter Scale DNA Assembly Utilizing the NEBuilder HiFi Cloning Kit with the Echo 525 Liquid Handler
- 卓上型セルソーターCytoFLEX SRTによるナノスケール粒子のソーティング
- What to do now that ACFTD is discontinued
- Low-pH profiling in µL-scale to optimize protein production in H. polymorpha using the BioLector
- Optimized NGS Library Preparation with Acoustic Liquid Handling
- Particle Counting in Mining Applications
- Performance of the Valita Aggregation Pure assay vs HPLC-SEC
- BioLector XT マイクロバイオリアクターを使った Chlorella vulgaris の光照射培養
- Plate Deposition Speed Comparison of Astrios and CytoFLEX SRT Cell Sorters
- Multisizer 4eによる脂肪細胞サイズの精密測定
- Principles of Continuous Flow Centrifugation
- Flow Cytometric Approach to Probiotic Cell Counting and Analysis
- Protocols for use of SuperNova v428 conjugated antibodies in a variety of flow cytometry applications
- 超遠心分離法によるエクソソームの高純度精製
- VTi 90ロータと塩化セシウム等密度勾配超遠心法(CsCl DGUC)を用いたウイルスベクター精製
- JP SDBS Validation
- USP System Suitability
- Calibrating the QbD1200+ TOC Analyzer
- Multisizer 4eを用いたブロッキング防止パウダーの粒子径の品質管理
- Using the Coulter Principle to Quantify Particles in an Electrolytic Solution for Copper Acid Plating
- A Rapid Flow Cytometry Data Analysis Workflow Using Machine Learning- Assisted Analysis to Facilitate Identifying Treatment- Induced Changes
- Rapid Measurement of IgG Using Fluorescence Polarization
- Valita Titer アッセイを用いた迅速なウサギIgG定量
- NGSライブラリ自動調製システム Biomek NGeniuS のエラー低減機能
- Root Cause Investigations for Pharmaceutical Water Systems
- Screening yeast extract to improve biomass production in acetic acid bacteria starter culture
- 卓上型セルソーターCytoFLEX SRTによるシングルセルソーティング
- スペクトルフローサイトメトリーでの自家蛍光の克服:埋もれていた自家蛍光シグナルを分離する
- Biomek i7ハイブリッド・加圧インテグレーションシステムによる除タンパクカートリッジを用いたビタミンD測定前処理の自動化
- Vi–CELL XRとVi–CELL BLUとの仕様比較
- スペクトルフローサイトメトリーの科学的概要
- Specifying Non-Viable Particle Monitoring for Aseptic Processing
- ベックマン・コールターの装置を使用してエクソソームの分離および特性評価を行うための標準化・自動化されたアプローチ
- アコースティック分注による合成生物学の合理化
- Switching from Oil Testing to Water and back using the HIAC 8011+ and HIAC PODS+
- SWOFF The unrecognized yet indispensable sibling of FMO
- ドライ抗体試薬DURACloneを用いたフローサイトメーターCytoFLEXによるヒトT細胞サブセットの13カラー解析
- The scattered light signal: Calibration of biomass
- Comparative Performance Analysis of CHO and HEK Cells Using Vi-CELL BLU Analyzer and Roche Cedex® HiRes Analyzer
- k-ファクタを利用したロータの効率比較
- Utilization of the MicroClime Environmental Lid to Reduce Edge Effects in a Cell-based Proliferation Assay
- Validation of On-line Total Organic Carbon Analysers for Release Testing Using ICH Q2
- 過酸化水素ガス滅菌によるVi–CELL BLUの性能評価
- 等密度勾配超遠心法によるアデノウイルスの精製: 垂直ロータの有用性
- Vesicle Flow Cytometry with the CytoFLEX
- Automating the Valita Titer IgG Quantification Assay on a Biomek i-Series Liquid Handling System
- Evaluating Clone Performance and Cell-Specific Productivity: Comparing the Cydem VT System and 10 L Bioreactor Cultivations
- 密度勾配自動作製装置 OptiMATE Gradient Makerを用いた迅速なアデノ随伴ウイルスの高純度精製
- 密度勾配自動作製装置OptiMATE Gradient Makerによるウイルスベクター精製におけるバラツキと作業時間の低減
- 自動セルカウント装置3種およびマニュアル法との比較によるVi-CELL BLUの変動性解析
- Automating the Valita Aggregation Pure Assay on a Biomek i-Series Liquid Handler
- Vi–CELL BLUの新機能、高速モード
- Vi-CELL BLU 規制への対応 – 21 CFR Part 11
- Whole Genome Sequencing of Microbial Communities for Scaling Microbiome and Metagenomic Studies Using the Echo 525 Liquid Handler and CosmosID
- 卓上型セルソーターCytoFLEX SRTを使用した 稀少なE-SLAM造血幹細胞のソーティングと その後の培養
- スペクトルフローサイトメトリーにおけるアンミキシングアルゴリズムの重要な役割
- 超遠心分離法によるウイルスベクターの精製
- 超遠心分析法を用いた脂質ナノ粒子の特性評価:包括的レビュー
- 超遠心分析法を活用した、薬物送達システムに使用する脂質ナノ粒子の特性評価
- 総合カタログ
- プロトコル
-
製品カタログ / データシート
- Access Single Robot System for Synthetic Biology Workflows
- Automated Solutions for Cell Line Development
- Automated Solutions for ELISA
- Echo Acoustic Liquid Handling for Synthetic Biology
- HIAC 8011+ Liquid Particle Counting Systems
- LS 13 320 XR - Laser Diffraction Particle Size Analyzer
- Download the Valita Titer Assay Brochure
-
導入事例 (インタビュー記事)
- 検査の効率化と精度向上を実現
- セルソーターを用いたバイオ燃料高産生藻のハイスループット遺伝子改変オートメーションシステム
- 高速冷却遠心機を用いたアデノウイルスベクターの効率的で再現性の良い調製方法
- 老舗の培地メーカーが挑む抗体開発と培地開発
- 研究に最適な卓上遠心機を選択するポイント
- がん遺伝子パネル解析/クリニカルシーケンスにおけるFFPE組織切片からのゲノムDNA抽出の重要性
- 大学における留学生を対象とした英語による遠心機の安全教育セミナーの有用性
- 大学における共通機器室の機器管理とサポート体制について
- 超遠心法を用いたエクソソームの分離精製
- Fast, Cost-Effective and High-Throughput Solutions for DNA Assembly
- High-throughput next-generation DNA sequencing of SARS-CoV-2 enabled by the Echo 525 Liquid Handler
- Leveraging acoustic and tip-based liquid handling to increase throughput of SARS-CoV-2 genome sequencing
- X線結晶構造解析のための膜タンパク質精製の基礎
- 密度勾配超遠心法による簡便な細胞小器官の分画
- 堆積地質学の研究における粒度分布測定
- Tierra Biosciences reveals major molecular discovery
- 大学の共通機器室での機器管理とサポート体制について
- 「細胞のごみ」を分解するオートファジーの 全容に迫る
- B細胞の生成と成熟、維持の研究を創薬にも活かす
- 生殖生物学の基礎研究と現在の生殖補助医療
- 動脈硬化の免疫的な機序から心血管疾患の治療と予後を研究 ― マルチカラーフローサイトメーターで研究を加速 ―
- 10カラーフローサイトメトリーを用いた細胞マーカー解析の有用性
- 新しいアプローチでの膠原病疾患治療に向けて
- 最善の総合医療を提供し、疾病の克服と健康の増進を通じて社会に貢献する
- 機能性抗体で免疫応答を制御し、新しい治療戦略と創薬に結びつける ― 研究を加速するフローサイトメーター ―
- 炎症の観点から疾患の発症メカニズムを解明し、治療薬を創出する
- 「運用の自由度」と「業務効率」を両立するカクテル抗体試薬活用の実際
- 現場に寄り添うサービスサポートと変化に備える一台
- 免疫研究で漁業の未来を変える - 研究の効率を上げるフローサイトメーター -
- 高精度の迅速診断に向けて - Navios EXによる造血器腫瘍細胞の10カラー解析の導入 -
- フローサイトメトリーによる造血器腫瘍解析検査の病院内実施がもたらすもの
- フローサイトメトリー検査を分割し、測定装置の特長を活かすことで生じる作業効率向上とその先
- 研究支援の未来を見据えて
- 細胞外タンパク質分解の新たな可能性を拓く
- 臨床検査技師育成におけるフローサイトメーター教育の重要性とCytoFLEXの活用
- EV研究を支える解析ツール:フローサイトメーターはどこまで進化した?
- iPS 細胞のメカニズムと 安全で効率のよい 樹立・維持法を追究
- 劇的に変わったワークフロー -AQUIOSによるCD34陽性細胞数測定-
- 粒子間の相互作用研究から、細胞と粒子の相互作用研究へ
- 遺伝子治療ベクターの品質評価における最新事情
- 虹彩細胞からの網膜細胞再生へ ~MoFlo Astriosの役割~
- iPS 細胞由来の “ 肝臓の芽 ” の移植で重度肝疾患の治療を目指す
- 患者の自己骨髄細胞を用いて肝硬変を治療する
- 超遠心法によるウイルス精製の基礎
- フライヤー
-
インタビュー記事
- フローサイトメーターを導入した経緯や導入後の現状について -順天堂大学医学部附属静岡病院-
- 水田土壌細菌の菌体計測における コールターカウンターの有用性
- iPS細胞由来ナチュラルキラー細胞の大量製造法開発における コールター原理の有用性
- 濁度計では測定が困難な微生物の「体積・菌数」の精確な測定法
- がん抑制遺伝子p53の標的遺伝子PHLDA3の機能解析進展と AMPure XPによるDNAクリーンアッププロセスへの貢献
- 小児白血病治療における中央診断 -小児白血病グループ研究統合の中での変遷-
- 小児白血病治療における中央診断 -小児白血病中央診断の現状-
- How the BioLector XT Microbioreactor and Biomek Liquid Handler solutions are transforming precision fermentation
- 生死細胞カウント方法における課題
- がん微小環境の1細胞解析におけるクラウドベース解析ソフトウエア Cytobankの貢献
- iGEM 2021 Kyotoチーム : FLOWEREVER 学部生による合成生物学の社会実装に向けた技術開発
- 院内検査室におけるフローサイトメトリー検査 -国家公務員共済組合連合会 虎の門病院-
- Fundamentals of Ultracentrifugal Virus Purification
- がん抑制遺伝子p53の標的遺伝子PHLDA3の機能解析進展とAMPure XPによるDNAクリーンアッププロセスへの貢献
- 籔井教授の講義シリーズ:超遠心機に振り回された研究を回顧して
- 再生医療分野での細胞集塊体積計測の重要性とMultisizer 4eの有用性
-
ポスター
- Applications of Ultracentrifugation in Purification and Characterization of Biomolecules
- Automating Genomic DNA Extraction from Whole Blood and Serum with GenFind V3 on the Biomek i7 Hybrid Genomic Workstation
- ABRF 2019: Automated Genomic DNA Extraction from Large Volume Whole Blood
- Automated library preparation for the MCI Advantage Cancer Panel at Miami Cancer Institute utilizing the Beckman Coulter Biomek i5 Span-8 NGS Workstation
- Automating Cell Line Development for Biologics
- Cell-Line Engeneering
- Characterizing the Light-Scatter Sensitivity of the CytoFLEX Flow Cytometer
- AACR 2019: Isolation and Separation of DNA and RNA from a Single Tissue or Cell Culture Sample
- 細胞数をカウントする方法
- Preparing a CytoFLEX for Nanoscale Flow Cytometry
- A Prototype CytoFLEX for High-Sensitivity, Multiparametric Nanoparticle Analysis
- ABRF 2019: Simultaneous DNA and RNA Extraction from Formalin-Fixed Paraffin Embedded (FFPE) Tissue
- Quantification of AAV Capsid Loading Fractions: A Comparative Study
- SARS-CoV2感染応答についての標準化ドライ抗体パネルを使用したフローサイトメトリーの有用性
- 製品の取扱説明書
-
ホワイトペーパー
- CytoFLEX mosaicが登るスペクトルサイトメトリーの山登頂と生還のための登山装備(アルゴリズム)たち
- 超遠心分析法がもたらすmRNA-LNP製剤CQA評価の新たな指標― 密度に基づくmRNA-LNPの品質特性の理解と管理 ―
- Centrifugation is a complete workflow solution for protein purification and protein aggregation quantification
- 分析用超遠心機:汎用性の高い、優れた高分子特性評価手法
- 遺伝子治療用ウイルスベクターにおける精製・品質管理の課題への取り組み
- 分析用超遠心機を用いたタンパク質間相互作用の解析
- Elevate Your Extracellular Vesicle (EV) Research – An Introduction to EVs
- Enhancing Molecular Studies with Multiwavelength Analytical Ultracentrifugation
- GMPクリーンルームの清浄度クラスと日常環境モニタリング
- AUC Insights - Assessing the quality of adeno-associated virus gene therapy vectors by sedimentation velocity analysis
- ホワイトペーパー:脂質ナノ粒子(LNP)研究ガイド
- フローサイトメトリーによる生物学的機構の解析
- USP<1788>Subvisible Particulate Matterの変更
- Automation Approach to Accelerate Antibody Drug Development
- Characterization of RNAdvance Viral XP RNA Extraction Kit using AccuPlex™ SARS–CoV–2 Reference Material Kit
- CytoFLEX Platform Gain Independent Compensation Enables New Workflows
- CytoFLEX Platform Flow Cytometers with IR Laser Configurations: Considerations for Red Emitting Dyes
- Evaluation of the Analytical Performance of the AQUIOS CL Flow Cytometer in a Multi-Center Study
- Simultaneous Isolation and Parallel Analysis of gDNA and total RNA for Gene Therapy
- Hydraulic Particle Counter Sample Preparation
- 密度勾配超遠心法による生体高分子高純度精製のしくみ
- ベックマン・コールター社製ウイルスRNA抽出溶解緩衝液を用いたCOVID-19疾患ウイルスSARS-CoV-2の不活化
- セルソーターの原理と細胞ソーティングのコツ
- 分析用超遠心機を用いた生体分子複合体の特性解析と測定時のサンプル濃度の関係性
- Liquid Biopsy Cancer Biomarkers – Current Status, Future Directions
- MET ONE 3400+ IT Implementation Guide
- Reproducibility in Flow Cytometry
- 大容量遠心の効率化
- SuperNova v428:新しいフローサイトメトリー用の高輝度蛍光色素
- ライフサイエンス分野製品 安全性データシート(SDS/MSDS)
-
アプリケーションノート
