Efficient Factorial Optimization of Transfection Conditions
Summary
- Automated the creation of 96 factorial combinations of different transfection reagents, concentrations, and cell numbers to improve transfection efficiency
- Fluorescent imaging assessed transfection efficiency and cytotoxicity
- Significant differences seen across three cell lines
- Factorial approach quickly becomes time consuming and error prone
- Combining Span-8 and multichannel selective tip pipetting eliminated the need for ~138 manual transfer steps
- Consistent low volume transfers (5 μL) even with large capacity (1200 μL) head provides added flexibility
Nucleic acid transfection is a procedure used in nearly any cellular laboratory and the abundance of commercially available reagents has made this a seemingly simple endeavor. However, whether one is transfecting plasmid DNA or inhibitory RNAs, different cell lines can have significant differences in the ease of transfection or cellular survival. Determining the optimal plating conditions for high transfection efficiency and low cytotoxicity can be highly involved. Differences can come from the transfection lipid chosen, the concentrations of the lipids and nucleic acids, and the number of cells plated. Here we demonstrate how a Design of Experiment (DOE) approach can be quickly automated on the Biomek i7 Automated Workstation (Figure 1) to identify optimal transfection conditions for a variety of cell lines.

Figure 1. Integrated Biomek i7 Automated Workstation. A Biomek i7 instrument with HEPA-filtered enclosure was directly integrated with a Cytomat 2C incubator (right) and SpectraMax i3X Multi-Mode Detection Platform with SpectraMax MiniMax 300 Imaging Cytometer (left).
Figure 2 illustrates the automated steps for the DOE approach. The Span-8 pipettors and the selective tip feature of the multichannel head were used to serially dilute different lipids and combine them with two concentrations of a FAM-labelled siRNA (siGLO Green) which acted as a transfection readout. The resulting 48 conditions were replicate stamped to a 384-well plate and two cell densities were added, resulting in quadruplicate wells of 96 conditions. This process, which would have required ~138 manual transfers with single and 8-channel pipettes, was completed in less than 20 minutes of automated pipetting. The Biomek i7 utilized its HEPA-filtered enclosure to maintain sterile conditions while performing liquid transfers.

Figure 2. Automated transfection optimization workflow. A) Automated transfers on the Biomek i7 Automated Workstation. 1) Transfection lipids (Lipofectamine RNAiMAX (L), DharmaFECT 1-4, and negative control (0)), Opti-MEM media (light orange), and two siGLO Green concentrations (purple) were added to a 96-well plate. 2) Lipids were serially diluted down 4 rows and replicate stamped. iGLO was replicate stamped across 5 additional columns. 3) 48 lipid dilution wells were combined with the 48 siGLO wells. B) The 48 conditions were stamped into a 384-well plate and cells were added at 7,500 or 15,000 cells/well. The blue wells in the plate map represent the quadruplicate values of 15,000 cells transfected with 100 nM siGLO in the presence of 0.8 μL DharmaFECT 1
This approach was used to determine optimal transfection conditions for colorectal carcinoma (HCT116), pancreatic epithelioid carcinoma (PANC1) and renal cell adenocarcinoma (ACHN) lines. 24 hours after transfection, DRAQ7 was added to measure transfection-induced cytotoxicity and media was replaced to reduce background fluorescence. To enable automation of the complete workflow, the Biomek i7 instrument was directly integrated with an incubator and a SpectraMax i3X Multi-Mode Detection Platform with SpectraMax MiniMax 300 Imaging Cytometer for cellular imaging analysis. The MiniMax cytometer counted total cells (brighfield), transfected cells (541 nm), and dead cells (713 nm). Figure 3 shows the images for a well of ACHN cells.

Figure 3. Measuring transfection efficiency and cytotoxicity. 24 hours after transfection with FAM-labeled siRNA oligonucleotides ACHN cells were stained with DRAQ7 to identify cytotoxic cells, and imaged with the SpectraMax MiniMax cytometer. A) Brightfield image utilized for total cell counts. B) 541 nm image utilized for transfected cell counts. C) 713 nm image utilized for dead cell count. D) Overlay of all three images.
Figure 4 shows the average values of the quadruplicate wells for the three cell lines for transfection efficiency and reproducibility (CV), cytotoxicity, and the percentage of negative control cell counts to detect any effect on cell growth or loss of dead cells during media exchange. While the highest concentrations of reagents consistently give high transfection efficiency, they frequently cause unacceptably high cytoxicity compared to the negative control wells. The bordered wells show the optimal conditions that give the maximal transfection efficiency with minimal toxicity, and which was seen consistently across the four replicate values (CV < 10%). These conditions are summarized for all three cell lines in Table 1. One can quickly see that ACHN cells require and tolerate higher
concentrations of reagents than PANC1 and HCT116, illustrating the value of transfection optimization.
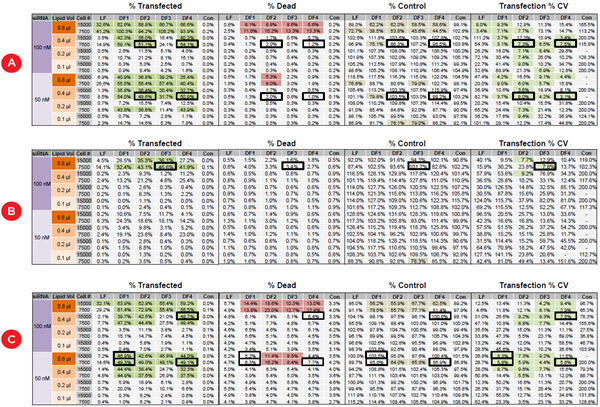
Figure 4. Identifying the optimal transfection conditions for three cancer cell lines. The values represent averages of quadruplicate wells for DOE transfection conditions for A) HCT116, B) ACHN, and C) PANC1 cells. Wells identified by shading include those above 30% transfected cells (dark green), those with cell death more than 5% above controls (red), those with less than 80% of the control cell counts (brown) and those with transfection CV ≤ 10% (light green). Black bordered wells indicate conditions with maximal transfection efficiency, low variability, and minimal cytotoxicity and cell loss.
Table 1. Results with optimal transfection conditions for each cell line.
| Cell Line | Lipid and Volume |
siRNA | Cells plated |
% Tf (541/BF) |
% Dead (713/BF) |
% Control (BF/BF) |
Tf% CV | Equivalent Alternative |
| HCT116 | 0.4 μL DF4 | 100 nM | 7500 | 54.20% | 1.20% | 96.50% | 7.50% | 0.4 μL DF2 50 nM siRNA |
| ACHN | 0.8 μL DF3 | 100 nM | 7500 | 46.60% | 3.40% | 101.70% | 7.80% | |
| PANC1 | 0.8 μL DF1 | 50 nM | 7500 | 49.30% | 6.30% | 85.60% | 5.80% | 0.8 μL DF4 |
Once optimal conditions have been established, the flexibility of the i7, with its large deck capacity, multichannel and span pipetting features, and ease of integrations means this same system can be used to apply these optimized conditions to large siRNA screens. These screens can benefit from the 1200 μL capacity of the multichannel head, which still has the ability to precisely transfer low volumes used in the 384-well assay described here.
