自動化システム活用による細胞株開発(CLD)における課題の克服
要約
- 細胞株開発(CLD)には、数ヶ月にわたる長期間の間で、多くの工程を段階的に進める必要があります。
- この工程を 自動分注ワークステーション Biomek i7 で自動化し、細胞株開発ワークフローにおける以下のような課題を克服しました。
- サンプルのコンタミネーション
- 半固体培地の安定的な分注
- 限界希釈によるモノクローンのプレーティング
- IgG解析および培養スケール化に向けた細胞のヒットピッキング
- 工程に必要な複数のデバイスを統合することで、以下が可能です
- 手作業によるラボウエアの移動時間を短縮
- 培養中の培地分注に必要な細胞数のカウント
- 細胞プレートを遠心分離し、モノクローンを迅速に確認
- コンフルエンシーと力価の自動測定によるヒットピッキング
- 複数の解析装置間のサンプル/データの整合性を数か月にわたって維持
はじめに
抗体医薬品開発などに向けた細胞株開発は、生細胞を利用します。一般的には治療用生物学製剤やその他のタンパク質を製造するプロセスで、浮遊培養したチャイニーズハムスター卵巣(CHO)細胞で抗体を産生し、バイオリアクターを使って製造します。細胞株開発には多くの工程があり、長期間にわたるため、多くの課題があり、困難なプロセスです(Figure 1)。
Figure 1. 細胞株開発プロセス。自動化される工程は赤で表示。
CHO細胞に目的の遺伝子発現ベクターを導入後、遺伝子発現細胞を選択し、濃縮します。次に単一の細胞を単離してコロニーを形成させ、タンパク質産生量を定量します。このスクリーニングが終了したら、タンパク質を最も効率よく生産する細胞を増殖・維持し、発現の安定性を調べます。最終的には、生産レベルにスケールアップする前に、培地条件のさらなる最適化やその他のタンパク質特性(グリコシル化など)を強化します。
このプロセスは終了まで数ヶ月かかるため、一般的な短期間の細胞ワークフローよりも多くの課題が生じます。まず、単一細胞を様々な操作で培養する数週間の間ずっと、無菌状態を維持することが必要です。次に、ほとんどのスクリーニングと同様、最適なクローンをいくつか選び出すためには、通常、数千ウェル規模のアッセイを実施する必要があります。アッセイ数は、ヒットピッキングフェーズ後は少なくなるので、スケジュールリングを適切に行うことで、リソースを最大化することができます。最後に、得られたクローン細胞株はヒットピッキング後に拡大培養され、細胞株が取得されるまでのデータを記録し続ける必要があります。今回は、細胞株開発におけるクローン細胞株の取得とスクリーニングを自動化して、これらの課題を克服した方法を紹介します。
自動細胞株開発システム
細胞操作とサンプル調製の全般を、Span-8ヘッドと容量1200 μL の96チャネルヘッドを備えた自動分注ワークステーション Biomek i7で行いました(Figure 2)。実験の全期間、HEPAフィルタ付きエンクロージャと滅菌済ピペットチップを使用しました。Biomekには、Cytomat 2Cインキュベーター(サーモフィッシャー)、マイクロプレート遠心機(アジレント) 、生死細胞自動セルカウンターVi-CELL BLU(ベックマン・コールター)を統合しました。CloneSelect Imager(モレキュラーデバイス)での細胞画像取得とOctet HTX(ザルトリウス)でのタンパク質定量はオフラインで実施しましたが、どちらのデバイスも自動分注ワークステーションBiomek i7に統合可能です。

Figure 2. 様々なデバイスを統合した自動分注ワークステーション Biomek i7
細胞株の選択と濃縮
今回の研究には、CHO細胞のDP12系を使用し、選択薬剤が存在しない場合、遺伝子発現は細胞ごとに変動が見られました。
まず、IgGを分泌する細胞集団を濃縮するため、インテグレーションしたVi-CELL BLUでCHO細胞をカウントし、1:100で希釈したCloneDetect試薬を含む半固体CloneMedia CHO Growth A 培地 22 mLに18,000細胞となるように撒きました。自動分注による精度の高いピペッティング操作により細胞を培地中にゆっくりと再懸濁し、気泡を導入しないよう6ウェルプレートに分注しました(A)。プレートを12日間インキュベートしてコロニーを形成させた後、ClonePix 2(モレキュラーデバイス, Figure 3A)で解析とピッキングを行いました。
Figure 3B は、ClonePix 2による明視野とFITCチャネルで撮影した6ウェルプレートの画像です。IgGを分泌するコロニーは、IgG分子が半固体培地内のコロニーの近くに集まり、CloneDetect試薬で染色されたため、蛍光のハローが示されました。コロニーの大きさ、形状、外部FITC強度などの特性によってコロニー(Figure 3C)を200 μLのCHO Growth A 培地を含む96ウェルプレートに移してさらに培養し、解析とモノクローナルコロニーの形成を行いました。

Figure 3. IgG 分泌細胞の濃縮。ClonePix 2 は、(A)画像を取得してサイズ(細胞増殖の度合)と外部蛍光(抗体分泌、B)から半固体培地中のクローンを同定。C) 最適なクローンを半固体培地から選択し、浮遊培養用の96 ウェルプレートに分注。
単一細胞の単離とコロニーの形成
単一細胞からコロニーを形成させるため、CHO細胞を懸濁し、生死細胞自動セルカウンター Vi-CELL BLUでカウントしました。最大83,300細胞を、カルセインAM 0.25 μMで、37 ℃で30分間染色しました。最初に細胞を25倍希釈した後、平均して300 μLあたり1個の細胞が存在するよう、XP CHO Growth A培地(モレキュラーデバイス)140 mLに約467個の細胞を播種しました。容量1200 μLのマルチチャネルヘッドで96 mLの吸引と分注を一度に行い、十分な混合と迅速なプレートへの分注ができました。細胞プレートを、インテグレーションしたマイクロプレート遠心機で300 xgで3分間遠心し、全ての細胞がプレート底部にあることを確認して、CloneSelect Imagerで高速な画像取得を行いました(Figure 4A)。
プレーティング後、明視野と蛍光チャネルでウェルの画像を取得し、カルセイン染色細胞をカウントしました。限界希釈法では、約33%のウェルに単一細胞が存在するように調製し、5回の実験を行いました(Figure 4Bに代表的なプレートを示します)。細胞を3週間培養し、細胞のコンフルエンシーを複数の時点で評価しました。コンディショナル培地(「考察」を参照)を使用した結果、約50%のモノクローナルウェルで増殖を認め、プレーティングしたウェルの約15%が細胞株確立の対象となりました(Figure 4C、ピンク色で囲ったウェル)。
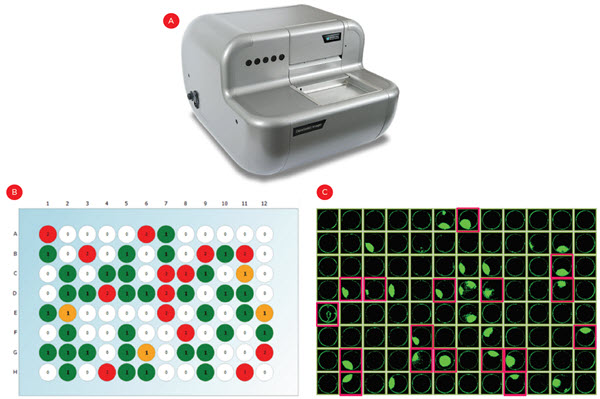
Figure 4.単一細胞由来コロニーの同定。限界希釈細胞をプレーティング後、CloneSelect Imager を使用して(A)各ウェルの蛍光染色された細胞をカウントし、モノクローナルウェル(B、緑色のウェル)を同定しました。(C)コロニーを形成したモノクローナルウェルを同定するため、3 週間にわたって細胞のコンフルエンシーを測定し、IgG 発現試験の結果を担保しました(ピンクのハイライト)。
タンパク質産生アッセイ
一般的なスクリーニングでは、全てのウェルを対象にしてアッセイを行うべきです。しかし、先の工程に進める可能性のあるウェルはわずか15%であるため、単一細胞からのコロニー形成が認められるウェルからのみ、培地をサンプリングしました。Span-8分注ヘッドで384ウェルプレートに培地を分注して、Octet HTXで解析し(Figure 5A)、Protein A BiosensorsでIgGを定量しました。
IgG解析では、Protein A標準試料を用いて結合曲線を作成し(Figure 5B)、アッセイしたウェルからの結合曲線(Figure5C)と比較してIgG濃度を決定しました(Figure 5D)。その後、高い発現を示す細胞を再懸濁し、ウェルの広い24ウェルプレートに移してコロニー形成と解析を行いました。

Figure 5. IgG 定量。 Octet HTX(A)で、既知の標準試料(B)と単一細胞由来コロニー(C)を含むウェルの結合曲線を測定。 標準試料を使用して未知のウェルのIgG を定量し、最も生産量の高いクローン(D、赤の丸で囲まれたもの)を次の工程に進めた。
細胞株開発のためのインテグレーションシステム
本アプリケーションノートで言及した複数の測定装置を1台のワークステーションとして統合することで、マニュアルによる操作が減り、時間節約とエラーのリスク減少につながります(Figure 6)。さらに、複数の測定装置が生成するデータを手動で転送や、操作することなく、そのまま使用して次の工程(ヒットピッキングなど)を実行できます。SAMIソフトウエアは、インテグレーションシステムによる複数のプレートの処理の管理や、細胞株開発など何週間もかかるアプリケーションの進捗を記録します。また、DARTソフトウエアはデータリポジトリとして、プロセス全体またはプロセス間でデータを保存しデータは簡単にアクセス可能で追加解析を行うことができます。 解析装置をインテグレーションすることで、長いワークフロー全体でサンプルとデータの整合性が向上します。
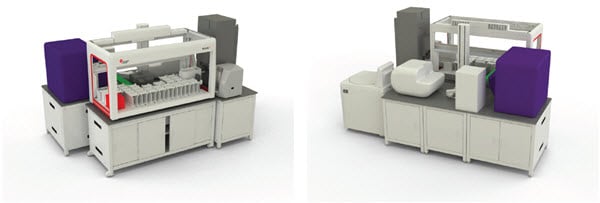
Figure 6. 細胞株開発のインテグレーションシステムの例(前面、背面)。
考察
本アプリケーションノートでは、細胞株開発において生じる非常に複雑な課題を、自動化ソリューションによって解決しました。これらの実験では、5週間以上の間、複数回にわたる操作において、細胞を無菌状態に維持することができました。自動分注ワークステーション Biomek i7を、CloneSelect ImagerとOctet HTXをインテグレーションすることで、細胞株開発に必要なスループットを保ちながら操作を自動化し、クローン評価を行うことができました。これらのデバイスをインテグレーションすることで、細胞株開発ワークフローの実行に必要な労力が大きく軽減されるとともに、手作業によるラボウエアやデータファイル処理に伴うエラーの可能性が排除されるため、データのトレーサビリティが向上します。
一方、他に対応を必要とする生物学的な課題もありました。1つ目は限界希釈工程の自動化に成功したものの、初期の細胞生存率と増殖率が低かったことです。最初に1 mL当たり 1X10⁵ のCHO細胞で2日間コンディショニング培養し 、既述のとおり50%の生存率となりました。増殖率が低い原因となったのは、自動プレーティングの問題ではなく、モノクローナル培養に課題があると考えられます。高濃度のカルセインは細胞生存率が下がる原因となります。CHO細胞株の種類にもよりますが、カルセインの濃度をできるだけ下げる必要があり、その場合にイメージングの時間が短くなってしまいます。検出時間が2時間以下の場合、 画像取得システムでの読み取り時間(CloneSelect Imagerではプレート1枚あたり約15分)があるのでプレート処理量が制限されてしまいますが、自動化メソッドでカルセインの追加やプレーティングのタイミングをずらすことで、この問題を克服できます。
コロニースクリーニングでは、他にも注意すべき点があります。細胞増殖の判断に細胞のコンフルエンシーを画像から判断しますが、培養開始時における細胞のウェル内位置に(中心部か端か、など)によりコロニーの形状が変わる可能性があり、コンフルエンシーと細胞数との相関を見ることが難しくなる場合があります。1細胞ごとのIgG生産量を特定することが望ましいですが、後の段階(培養スケール拡大時)で行う方がより正確な細胞数を得ることができます。 IgG定量のもう1つの課題は、3週間の培養中に蒸発が起こる場合があることです。蒸発に対応できる特殊なプレートも対策に有用ですが、今回はより簡単な方法として、各ウェルに培地を300 μL追加して蒸発を軽減しました。細胞数と同様、IgG産生も、細胞培養拡大時およびゲノム安定性試験中の方がより正確に測定できます。
細胞株開発ワークフローの各工程は極めて普遍的なもので、他にも様々な方法があります。シングルセルプリントや細胞ソーティングは、より効率的にモノクローナルウェルを作成する手段です。ELISAまたはその他のアプローチでも抗体力価の測定が可能で、それらを自動化することで効率的に処理できます。
今回説明した工程の順序は柔軟に変更することも可能です。私たちはイメージングを使って単一細胞から増殖したウェルを同定しました 。そうすることで、当該ウェルのみをOctet バイオセンサーでアッセイすることができます。仮にモノクローンを測定できる蛍光イメージャーがない場合は、プレーティング後に全ウェルの画像を明視野で取得し、タンパク質産生アッセイを全てのウェルで行う必要があります。その場合は抗体発現量が高いウェルのみで細胞の単一性を確認する流れとなります。
最後に、細胞株開発ワークフローでは、今回紹介した以外にも、自動化してメリットが得られた例があります。例えば、細胞培養を自動化し、クローン安定性に必要な繰り返し継代に伴う負担を軽減した例です(Consistent Cell Maintenance and Plating through Automation、AAG-2585APP04.17)。さらに、培地組成を最適化してタンパク質の産生を増やす実験計画も自動化することが可能です(Automated Optimization of IgG Production in CHO Cells、AAG-2148APP11.16)。また、濃縮、限界希釈、ヒットピッキング工程およびデータ処理の自動化した例もあります(Cell Line Development Data Handling AAG-3996APP08.18、Cell Line Development Hit Picking AAG-3998APP08.18、Cell Line Development Limiting Dilution AAG-399APP08.18、Cell Line Development Selection and Enrichment AAG-4000APP08.18)。細胞株開発プロセスを可能な限り自動化することで、各工程での労力を最小限に抑え、サンプルとデータの整合性を最大限に高めることが可能となります。


