A Rapid Flow Cytometry Data Analysis Workflow Using Machine Learning- Assisted Analysis to Facilitate Identifying Treatment- Induced Changes
Objective
In this Application Note you will learn:
- How to leverage a dimensionality reduction algorithm like viSNE for visual comparisons between groups of samples
- How FlowSOM can help you in highlighting differences in abundance of specific clusters in your experimental groups
- How to use heatmaps to help you identify the phenotype of a specific cluster/metacluster
Methods
To generate the data used in this Application Note, cryopreserved human peripheral blood mononuclear cells (PBMC) from healthy donors were thawed and rested overnight for cell function recovery; stimulated using Dynabead T-cell Activator anti-CD3/CD28 (ThermoFisher Scientific) in presence of protein transport inhibitor (Brefeldin A). Lineage markers and cytokine expression were assessed after six hours with a 13-color antibody cocktail described below (Table 1). Data were acquired on a 13 detector / 3 laser CytoFLEX V5-B5-R3 (PN: C09734); compensation and logicle transformation were adjusted using Kaluza Analysis software. Transformed data was exported using the Kaluza Cytobank Plugin.

Table 1: 13 color panel
Introduction
When looking at how a specific experimental condition, i.e., a specific treatment, can affect cell populations present in your samples, you need to be sure that the effect you’re seeing is the consequence of a common biological phenomenon, not specific for one single sample. Thus, many samples that underwent the same treatment need to be visualized.
With advances in technologies, the number of parameters that can be analyzed together in each flow cytometry panel keeps increasing, and if we sum this up with the need for testing and analyzing many samples together, the analysis step can become overwhelming.
Dimensionality reduction tools, such as viSNE maps 1, enable you to reduce high dimensional data into two dimensions, thereby enabling rapid exploratory analysis and visualization of complex results. In a viSNE map, cells that are phenotypically similar will be close to each other and may form an island. This makes viSNE a good option when you are exploring a way that can help define biological effects in a fast and visual fashion. Indeed, with viSNE maps 1 you can quickly identify and visualize changes among your samples due to different experimental conditions (i.e. treatments) as they may result in the presence or absence of a specific island in the viSNE map.
In our example, we had eight FCS files, derived from four different healthy donors, each one either stimulated or not with anti-CD3/CD28 beads. A viSNE run was performed within the Cytobank platform on all files, in order to obtain the same map across all samples. Sample tags were assigned to each FCS file in order to define conditions (e.g. Unstimulated, Stimulated) and individuals (HD1, HD2, HD3, HD4). Sample tags allow working one step above FCS file names, using the variables present in the experiment to create meaningful figures. In our example the use of sample tags to visualize donors in different columns and stimulation conditions in different rows helped to identify the changes due to the stimulation, as judged by the increase in abundance of cells in the blue gate; and to confirm that a similar change is common in all donors tested. (Figure 1)

Figure 1: Density plot of viSNE maps highlighting changes across different samples. viSNE was run on single cells, 200,000 events total, equal sampling, on all 13 markers, with 1000 iterations, 30 perplexity and 0.5 theta. The gate was drawn in the Gate Editor within the Cytobank platform to show percentage of cells within the specific island.
FlowSOM 2 is an algorithm that speeds time to analysis and quality of clustering with Self-Organizing Maps (SOMs), that can reveal how all markers are behaving on all cells, and can detect subsets that might otherwise be missed; it therefore helps define cells clusters with the same phenotype, and can be applied to better define which markers are expressed by the cells inside our gate.
In our example, following the dimensionality reduction, a FlowSOM analysis was performed to automatically cluster the cells into 12 so-called metaclusters. The dot plots colored by channel functionality were then used to color each event in the viSNE map according to the metacluster it belongs to. Ideally there should be a good correlation between metaclusters and islands of the viSNE map; this will tell you that the settings used are correct or, if not, that you should modify the settings (e.g., number of iterations). To get more insights into how to correctly set up a FlowSOM please visit the Cytobank Learning Center for tailored support articles and videos.
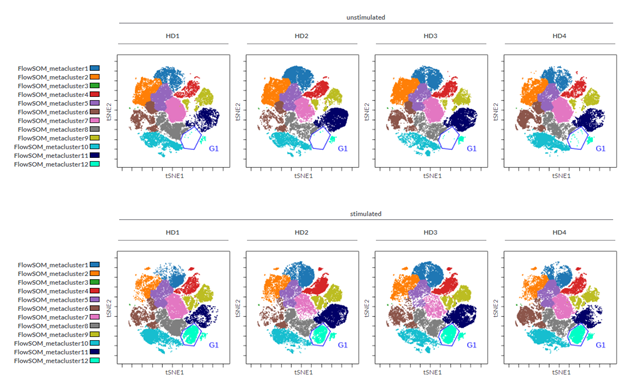
Figure 2: viSNE maps with twelve FlowSOM metaclusters as overlaid figure dimensions for each sample.
To quickly identify phenotype of the subpopulation of cells increased by the stimulation, it can be helpful to build a heatmap view of all metaclusters identified by the FlowSOM run, or of the specific gated population G1 (Figure 3). The heatmap uses colors to visually render an overview of the degree of expression of each marker for a specific cell subset (i.e., gated cells or metaclusters). This means that when you look at your heat map, you can quickly see which markers are expressed by that group of cells. In our example it is easy to determine that the gated population is CD4+CCR7+ T cells that secrete TNF alpha.

Figure 3: Heatmap visualization of median values for each marker expression by cells in G1 gate. Data from two representative donors, HD1 and HD2, is shown.
Also, if you want to compare metacluster abundances quantitatively, you can download results of the FlowSOM run, go to the Experiment Summary Page and look for Attachments.

In the downloaded results folder, you will find an excel file called “metacluster_abundance” containing the values you want to compare. You can then use any statistical program to identify statistically significant differences.
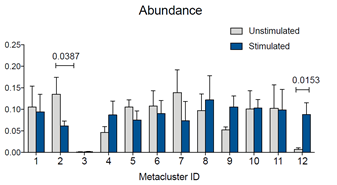
Figure 4: Abundance for metaclusters identified by the FlowSOM run. Abundance for each metacluster is expressed as “number out of 1.” Statistical test was performed in GraphPad Prism by two-way ANOVA followed by Bonferroni’s multiple comparisons test. P values for statistically significant differences are indicated.
TIP for SUCCESS:
Heatmaps can help you identify the phenotype of a specific cell population. If you want a more detailed /granular view, you can check your data easily just by moving the cursor on one heatmap square in the Cytobank interface: the respective plot will be automatically displayed, and you will be able to visually check the accuracy of your results (Figure 5).
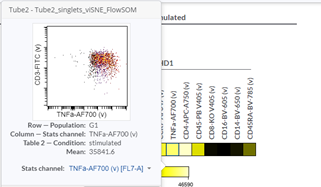
Figure 5: Dot plot corresponding to a square in the heatmap.
As you get started with these types of analyses you might want to discuss data with colleagues: inside the Cytobank platform all you need to do is access the Experiment Manager and share the experiment. This will allow your collaborators not only to see your results, but also be able to access raw data and all settings used, as within the platform all data are kept interconnected and easily auditable.
References
- David Amir, El-Ad & L Davis, Kara & Tadmor, Michelle & Simonds, Erin & Levine, Jacob & Bendall, Sean & Shenfeld, Daniel & Krishnaswamy, Smita & Nolan, Garry & Pe'er, Dana. (2013). ViSNE enables visualization of high dimensional single-cell data and reveals phenotypic heterogeneity of leukemia. Nature biotechnology. https://doi.org/31.10.1038/nbt.2594.
- Van Gassen S, Callebaut B, Saeys Y (2019). FlowSOM: Using self-organizing maps for visualization and interpretation of cytometry data.
Please note that the experiment has been conducted in house.
This document does not replace Instructions for Use.
For Research Use Only. Not for use in diagnostic procedures.
© 2020 Beckman Coulter, Inc. All rights reserved. Beckman Coulter, the stylized logo and the Beckman Coulter product and service names mentioned herein are trademarks or registered trademarks of Beckman Coulter, Inc. in the United States and other countries. All other trademarks are the property of their respective owners.
