Root Cause Investigations for Pharmaceutical Water Systems
Introduction
Regulatory authorities expect manufacturers to investigate deviations take corrective action, put in place interventions to prevent recurrence of the deviation and to assess the effectiveness of those interventions. Without adequate root-cause investigation, the success of those interventions is questionable.
However, TOC or conductivity contamination events can be transient in nature. For example, a water system that is experiencing gradual biofilm build up may experience TOC excursions in the distribution loop just after sanitisation cycles as biofilm sloughs off the inside of the pipework. This excursion in the distribution loop can quickly disappear by being diluted as the water passes into the large quantity of water in the storage tank, or by being oxidised and broken down by UV lamps connected to the distribution network put in place to discourage microbial build-up. This transient nature makes root-cause investigations difficult as it is not easy to get a sample of the excursion as there is not enough time to do so. However, this rapid disappearance may mask the increasing biofilm build up until there is a breakdown of system control and run-away microbial contamination.
In this paper we discuss some typical sources of contamination in water systems and how root-cause investigations can be supported using on-line Total Organic Carbon (TOC) analysers.
To watch a webinar on this topic, please scroll to the bottom of this page.
FDA water quality expectations
The use of the terms Purified Water (PW) and Water For Injection (WFI) implies that these waters meet the quality expectations defined by the pharmacopoeias. There are four critical quality attributes that define PW and WFI:
- Microbial colony forming units (CFU) – potentially harmful bacteria that might cause infection and illness in patients
- Conductivity – inorganic contaminants that are not meant to be present and could cause illness in patients
- Total organic carbon (TOC) – organic material that may encourage microbial growth in water systems
- Endotoxins – pyrogenic substance found in the cell wall of gram-negative bacteria that can cause a fever if injected into patients
Currently only conductivity and TOC can be measured on-line in real time. Both the CFU and endotoxin tests are laboratory-based tests. In their report prepared for the European Directorate, the EDQM Expert Workshop2 recommended a focus on TOC and conductivity as early indicators of potential microbial contamination or increase in microbial by-products, which could be endotoxins. Water system TOC or conductivity deviations could be precursors to potential endotoxin or microbial excursions and should be investigated, but these events are frequently transient in nature and, by the time grab samples are taken to help the root-cause investigation, the excursion has disappeared.
Viable non-culturable
Microbes that are viable but non-culturable could be said to be incapable of proliferation and considered sterilised. However, microbes that are no-longer living can be said to be sanitised, i.e. without life. Whilst heated water systems may keep microbes from proliferating, i.e. sterilised, microbes can still exist in the biofilm that builds up over time in water systems5, which is why we have to repeat heat sterilisation on a regular basis. If it truly was a sanitised environment, i.e. absent of life, then you wouldn’t need to repeat the heating process.
Examples of sources of contamination
TOC from solvent in bulk Active Pharmaceutical Ingredient (API) plant
The author heard about one root-cause investigation in a bulk API manufacturing facility which lead the team to suspect contamination from one of the organic solvents used in the API manufacturing process, but how did it get into the WFI water system? Physical inspection of the location of the WFI storage tank showed that there was a production waste drainage cover near to the tank, but still how was the solvent getting into the tank? By examining the pattern of TOC excursions, the team was able to determine that the excursions closely followed the end of a production run when the production vessels were being cleaned down ready for the next batch. Thus a unique combination of events where happening simultaneously: there was a large demand for WFI from the storage tank to complete the cleaning of the production vessels whilst at the same time the waste containing the solvent was passing down the drain and, being a volatile substance, some of the solvent formed a vapour above the drain. Rapidly dropping water levels inside the WFI tank caused air to be drawn into the tank through the vent, which was situated over the drain cover. Clearly solvent vapour was being drawn into the tank along with the air. Re-siting the WFI storage tank vent away from the drain cover provided a permanent solution preventing recurrence of the contamination event.
TOC from autumn leaf-fall
Levels of organic material in source water can also vary according to the season. In autumn, high levels of leaf-fall can increase organic content of feed waters, which then become a challenge to PW make-up treatment plants. Treatment plants are designed to remove a percentage of the incoming water contaminants, but an increase in contamination levels in the incoming water may result in turn in increases in contamination levels in the PW system.
TOC from point of use
Although water systems are pressurised, it has been known for a syphoning effect to occur when a point of use is first opened. When taking grab samples for microbial and endotoxin testing in the laboratory, it is usual practice to wipe the point of use down with industrial alcohol (IPA) to prevent any potential microbial contamination of the sample by microbe present on the outside of the point of use. However, this alcohol is an organic material and, should some be syphoned into the point of use, then this could lead to a TOC excursion.
TOC from RO integrity breach
The chapter for WFI in the European Pharmacopeia changed in March of 2016 to allow for the first time the generation of WFI using reverse osmosis (RO)1. In their report prepared for the European Directorate, the EDQM Expert Workshop2 warned that reverse osmosis systems may not be as robust as stills and recommended a focus on on-line TOC and conductivity as early indicators of potential microbial contamination or increase in microbial by-products, which could be endotoxins. Concerns were expressed that microbial build-up on the feed water side of the RO, could potentially break through the RO membrane and contaminate the water system. Equally microbial by-products such as endotoxins may pass through the RO membranes. These would be picked up as an increase in TOC levels and possibly also as a change in oxidation profile.
False TOC results
All pharmaceutical-grade TOC analysers use UV light to oxidise the organic molecules and release the carbon in the form of carbon dioxide. TOC results can be reported higher than they actually are through sensor drift in TOC analysers utilising two sensors to measure Total Carbon (TC) and Total Inorganic Carbon (TIC) and then calculating TOC.
Equally, ageing of the UV lamps will gradually affect the intensity of the UV light produced. In constant-flow TOC analysers where the sample has a fixed exposure time to the UV light, this drop-off in intensity may lead to under-reported TOC values, which would remain un-detected until the UV lamp was replaced.
The EP 2.2.44 chapter on TOC analysis emphasises the importance of complete oxidation of the organic contamination in order to get an accurate TOC measurement4. Longer chain, more complex organic molecules may create organic acids in the process of being oxidised down to CO2. Organic acids may contribute more strongly to the conductivity measurement than the final CO2 from the completely oxidised organic, so failure to ensure complete oxidisation of the organic may result in an incorrect TOC value.

Figure 1. Intermediate species created during partial oxidation can be the cause of false TOC results
Support for root-cause investigations
Avoiding false TOC results
The primary method used by most pharmaceutical-grade TOC analysers to oxidise the TOC is UV light. Almost all TOC analysers using UV light only have a single UV lamp and do not monitor the level of UV light the lamp emits, thus potentially ignoring a reduction in UV light output that may compromise the analyser’s ability to measure TOC. Typical lifetime of these UV lamps is around 12 months and if the UV lamp fails completely, then the analyser will no-longer be able to analyse TOC. In modern WFI systems the level of TOC can be <10ppb and a failed TOC analysis UV lamp may go un-noticed, leaving potential TOC excursions in the WFI system to pass undetected. If a failure of the UV lamp is detected by the user, it may trigger the need for increased grab sample TOC analysis by the QC laboratory until the TOC analyser can get repaired. The PAT700 has main and a standby UV lights and monitors the UV light output. Should the UV light from the main lamp fall below an acceptable level for good TOC analysis, then the standby lamp is automatically activated and an alarm set to notify the user.

Figure 2. The PAT700 protects against unplanned down-time and expensive service call-outs by having auto-switching main and stand-by UV lamps
As different organic materials may require different oxidation times to completely turn all of the carbon present to carbon dioxide for accurate TOC measurement, the PAT700 monitors the change in the conductivity measurement and waits until there is no more change in order to detect that the organic has been completely oxidised, thus ensuring accurate TOC analysis. It also has just one measurement cell to measure TIC and TC, so sensor drift will not affect the accuracy of the calculated TOC.
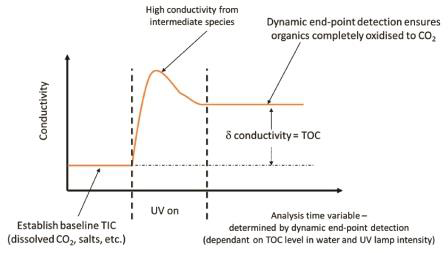
Figure 3. PAT700 uses dynamic end-point detection to ensure complete oxidation for accurate TOC analysis, even when UV lamp intensity decreases
Excursion capture
The PAT700 can be programmed to capture a water sample the instant that a TOC excursion is detected so that the sample can be further analysed to get to root cause.
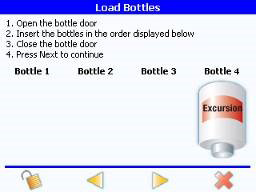
Figure 4. The PAT700 can capture a water sample to support root cause analysis if a TOC excursion is detected
Calibration best practices
It is important to ascertain that any reported deviations in TOC or conductivity levels are a real deviation and not in fact caused by a drift in the calibration of the analysers. So the first step in any root cause investigation following a deviation is to check that the TOC or conductivity analyser is still measuring accurately.
Typically, most pharmaceutical manufacturers have their TOC analysers calibrated on a six-monthly basis. There are two types of calibration; calibration validation and calibration adjustment.
For calibration validation, certified calibration standards are run as grab samples and the performance of the TOC analyser is compared to the certified values. A ‘Pass’ is given if the reported values from the TOC analyser are within an acceptable percentage of the certified values of the standards (blank subtracted).
For calibration adjustment, certified calibration standards are run through the TOC analyser. The TOC analyser adjusts its calibration slope to give a best fit against the certified values of the standards. As long as the TOC analyser is able to change its slope to give a correlation coefficient (linearity factor) ≥0.990 and as long as the change in the calibration slope of the TOC analyser is not a large change from the original factory calibration, then the new calibration is considered acceptable and a ‘Pass’ is given. A change in the calibration slope that is a large deviation from the factory slope is considered an indication that something has gone wrong, i.e. either the analyser is not working correctly, or the calibration standards are not matching their certified value.
Although not mandated, it is considered best practice to carry out the following step-by-step procedure when calibrating a TOC analyser:
- Carry out an ‘as found’ calibration validation before any maintenance or adjustments are made. This confirms that the TOC analyser has been working within specification
since the last calibration and that nothing has gone wrong since then. - Carry out a calibration adjustment. This ‘fine tunes’ the calibration of the TOC analyser to make it as accurate as possible and protects against gradual drift in calibration over extended periods of time
- Carry out an ‘as left’ calibration validation. This confirms that the calibration slope adjustment made in Step 2) has resulted in an accurate calibration compared to traceable, certified standards

Figure 5. 'As found' calibration carried out before any maintenance procedures to confirm TOC analyser is still performing acceptably after 6 month's use
System Suitability
This test is designed to ensure that the TOC analyser is capable of analysing equally the range of organic contaminants that might occur in PW and WFI. This takes on a particular significance with the concerns around potential microbial contamination or from microbial by-products as the type of organic contamination may change with time.
Conductivity calibration
The weakness of traditional conductivity instruments is that the measurement cell is inside the WFI pipe and inaccessible so the cell constant cannot be checked as recommended in the United States and European pharmacopoeias (USP and EP)3,4 using a conductivity solution of a known, certified value. TOC analysers that use direct conductivity measurement as part of their TOC analysis such as the PAT700 from Beckman Coulter can have the cell constant checked as the sample entering the conductivity cell subsequently goes to drain and therefore does not compromise the water loop itself.


Figure 6. The PAT700 direct conductivity analyser cell constant can be verified according to the requirements in USP <645>
Most TOC analysers cannot comply with the USP and EP requirements to check the accuracy of the conductivity meter electronics using an external resistor. The PAT700 has been designed specifically to support this requirement, thus satisfying all the compliance requirements of the USP and EP as a conductivity analyser.

Figure 7. PAT700 direct conductivity analyser meter accuracy can be verified using external resistor as per the requirements of USP<645>. Item 1 indicated in the illustration represents the external calibration resistor
Detecting changes in water organic chemistry
As different organic materials can produce different TOC oxidation profiles, a change in the oxidation profile may indicate a change in water organic chemistry. The European Pharmacopoeia emphasises the need for complete oxidation of the organic contamination to ensure accurate TOC analysis4.
An increase in TOC levels combined with a change to the oxidation profile could be an indicator of a change in the organic chemistry of the water and should be investigated before a potentially larger excursion occurs.
Some TOC analysers, such as the PAT700 from Beckman Coulter, provide an indication of the oxidation curve profile during each TOC analysis. A change in the type of profile, combined with a change in TOC levels may provide insight into a potential degradation of the RO system integrity, prompting the user to investigate further and consider corrective action to prevent a large-scale contamination event and to put in place preventative measures to avoid the recurrence of the problem in the future.

Figure 8. Changes in TOC oxidation profile curve can indicate potential degradation of water treatment integrity, prompting investigation to prevent a large-scale contamination event
Grab sample analysis
As part of the root cause investigation, in order to identify if the contamination is coming from one of the points of use on the water loop grab samples should be taken at different points on the loop.
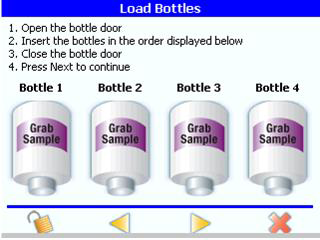
Figure 9. Analysing point of use grab samples to help with root cause investigations
The PAT700 from Beckman Coulter allows users to analyse up to four grab-samples at a time using the on-board auto-sampler. 21CFR part 11 compliance is enabled for the results as they are generated in secure, password protected PDF files including the technician’s electronic signature.
Conclusion
As PW or WFI contamination events can be transient in nature, TOC analysers that can capture a sample of the contaminated water can provide valuable assistance in root-cause investigations. Data on changes to the oxidation profiles from the TOC analyser can be a useful indicator of potential changes to water organic chemistry, providing an early warning of potential deterioration in RO membranes. At the same time, avoiding false high or low TOC results through robust analyser design can help reduce wasted time in un-needed root-cause investigations and avoiding the ‘no fault found’ results that the regulators do not like. Thoughtful choice of TOC analyser can provide much needed support for water system deviation root-cause investigations.
References
- European Pharmacopeia (Ph. Eur.) Commission press release 18th March 2016 https://www.edqm.eu/sites/default/files/press_release_water_for_injections_march_2016_0.pdf
- EDQM Expert Workshop, 24 March 2011 European Directorate for the Quality of Medicines & Healthcare (EDQM) 7 allée Kastner, CS 30026 F -67081 Strasbourg
- US Pharmacopeia Convention, United States Pharmacopoeia, Rockville MD, USA and Council of Europe, European Directorate for the Quality of Medicines & Healthcare, European Pharmacopoeia, Strasbourg, France
- Council of Europe, European Directorate for the Quality of Medicines & Healthcare, European Pharmacopoeia 8.0, 01/2008:20244, Total Organic Carbon in Water for Pharmaceutical Use, Strasbourg, France
- International Society for Pharmaceutical Engineering, The ISPE Good Practice Guide: Ozone Sanitization of Pharmaceutical Water Systems, First edition July 2012 http://www.ispe.org/ispe-good-practice-guides/ozonesanitization-pharmaceutical-water-systems [14th August 2014]
- Pharmaceutical and Healthcare Sciences Society, Best Practice for Particle Monitoring in Pharmaceutical Facilities,
PHSS Technical Monograph No.16, First Edition 2008, ISBN 978-1-905271-15-3
