
Cross-Site Optimization and Robustness Study Comparing Vi-CELL BLU and Vi-CELL XR Analyzers at GSK
Introduction
Cell counting is the primary method used to understand the behavior of cells throughout the biopharmaceutical development process. Having an accurate measurement of the number of viable cells is necessary for passaging cells at the correct seeding density to ensure the correct ratio of cells to fresh media to allow optimal growth.1 It is critical to obtain accurate cell density measurements to ensure consistency of specific unit operations and overall robustness of the process. The cell viability measurement is used to monitor the health of the cells throughout the process, beginning from vial thaw, and can determine harvest timing at the end of the production bioreactor.2 A cell counter that provides reproducible measurements of the number of viable cells and the cell viability in each sample—regardless of user and location—is essential to the success of an upstream biopharmaceutical process, especially as the project progresses from development to manufacturing.
The Vi-CELL XR analyzer has been one of the standard methods to count cells across the biopharmaceutical industry but, as of December 2022, was retired by Beckman Coulter Life Sciences. GSK used this instrument across all cell culture development and manufacturing sites to ensure consistency during process transfer between sites. Recognizing the need to find a new cell counting/viability analyzer for use across GSK, a survey of available instruments was performed. This concluded with the decision to move forward with the Vi-CELL BLU analyzer as a replacement. As the next-generation Vi-CELL instrument, it provides improved sampling throughput and enhanced safety features, as well as a streamlined design that decreases required benchtop space.3 After selection, an initial technology feasibility assessment was conducted by a team comprised of representatives from manufacturing technology, development, statistics and engineering. Following a successful assessment, the decision was made to move forward with a more comprehensive robustness evaluation of the Vi-CELL BLU analyzer. This robustness evaluation consisted of multiple experiments across four diverse sites: a cell line development lab, process development lab, pilot plant and commercial manufacturing site. The evaluation consisted of a preparation and execution phase. The preparation phase included the identification of stakeholders among research, development and manufacturing entities; collection of user requirements; and optimization of the instrument’s parameters. The optimization study was performed across the four identified sites within GSK and was used to set the ‘Cell Type’ for the Vi-CELL BLU analyzer to best match the results obtained when using the platform CHO ‘Cell Type’ on the Vi-CELL XR analyzer. Once the ´Cell Type´ was set (Table 1), the execution phase was initiated at the same four sites with the goal to prove non-inferiority of the Vi-CELL BLU instrument. Overall, the error between the Vi-CELL BLU and Vi-CELL XR instruments was determined to be smaller than or similar to the error between two Vi-CELL XR instruments, successfully proving non-inferiority. This led to the decision to move forward with replacing the Vi-CELL XR analyzer with the Vi-CELL BLU analyzer. Cell counting is the primary method used to understand the behavior of cells throughout the biopharmaceutical development process. Having an accurate measurement of the number of viable cells is necessary for passaging cells at the correct seeding density to ensure the correct ratio of cells to fresh media to allow optimal growth.1 It is critical to obtain accurate cell density measurements to ensure consistency of specific unit operations and overall robustness of the process. The cell viability measurement is used to monitor the health of the cells throughout the process, beginning from vial thaw, and can determine harvest timing at the end of the production bioreactor.2 A cell counter that provides reproducible measurements of the number of viable cells and the cell viability in each sample—regardless of user and location—is essential to the success of an upstream biopharmaceutical process, especially as the project progresses from development to manufacturing. The Vi-CELL XR analyzer has been one of the standard methods to count cells across the biopharmaceutical industry but, as of December 2022, was retired by Beckman Coulter Life Sciences. GSK used this instrument across all cell culture development and manufacturing sites to ensure consistency during process transfer between sites. Recognizing the need to find a new cell counting/viability analyzer for use across GSK, a survey of available instruments was performed. This concluded with the decision to move forward with the Vi-CELL BLU analyzer as a replacement. As the next-generation Vi-CELL instrument, it provides improved sampling throughput and enhanced safety features, as well as a streamlined design that decreases required benchtop space.3
After selection, an initial technology feasibility assessment was conducted by a team comprised of representatives from manufacturing technology, development, statistics and engineering. Following a successful assessment, the decision was made to move forward with a more comprehensive robustness evaluation of the Vi-CELL BLU analyzer. This robustness evaluation consisted of multiple experiments across four diverse sites: a cell line development lab, process development lab, pilot plant and commercial manufacturing site. The evaluation consisted of a preparation and execution phase. The preparation phase included the identification of stakeholders among research, development and manufacturing entities; collection of user requirements; and optimization of the instrument’s parameters. The optimization study was performed across the four identified sites within GSK and was used to set the ‘Cell Type’ for the Vi-CELL BLU analyzer to best match the results obtained when using the platform CHO ‘Cell Type’ on the Vi-CELL XR analyzer. Once the ´Cell Type´ was set (Table 1), the execution phase was initiated at the same four sites with the goal to prove non-inferiority of the Vi-CELL BLU instrument. Overall, the error between the Vi-CELL BLU and Vi-CELL XR instruments was determined to be smaller than or similar to the error between two Vi-CELL XR instruments, successfully proving non-inferiority. This led to the decision to move forward with replacing the Vi-CELL XR analyzer with the Vi-CELL BLU analyzer.
Methods
Four sites were involved in the robustness studies, representing both development and manufacturing at GSK. At all four sites, two Vi-CELL XR and two Vi-CELL BLU instruments were used for all samples to determine variability between and within each type of instrument. At least two sites ran samples in triplicate to determine variability within an individual instrument. Beckman Coulter Life Sciences provided support by performing preventive maintenance on each instrument before beginning the studies to ensure each instrument was calibrated and functioning properly.
Samples were removed from a shake flask or bioreactor and diluted if necessary to <10 million cells/mL using PBS or TrypLE. The sample was then split four ways, with 1.0 mL sample for each Vi-CELL XR analyzer and 0.3 mL sample for each Vi-CELL BLU analyzer. The sampling was performed this way to remove any error related to the sampling process or dilution (Figure 1). When loading the samples on the instruments, an effort was made to not always load the instruments in the same order to prevent any error related to timing of the sample loading. The samples were taken from a variety of cell lines at a range of viable cell concentrations (VCC) and percent viabilities to ensure the conclusions from the robustness study would be widely applicable to any cell line under any combination of VCC and percent viability.
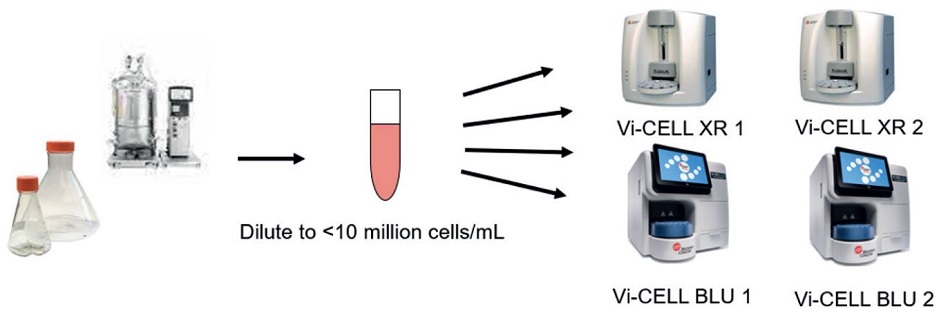
Figure 1. Samples were aseptically removed from shake flasks or bioreactors at a range of high and low VCC and percent viability conditions. If necessary, the samples were diluted to <10 million cells/mL using PBS or TrypLE. The samples were then run on the four instruments, two Vi-CELL XR and two Vi-CELL BLU instruments, at each of the four sites.
The goal of the optimization portion of the preparation study was to determine the ‘Cell Type’ settings for the Vi-CELL BLU instrument that led to viable cell count and percent cell viability results that matched those output by the Vi-CELL XR instrument. Working with Beckman Coulter Life Sciences representatives and the provided reference document,4 an initial suggested ‘Cell Type’ for the Vi-CELL BLU instrument was developed. Then, variants of this ‘Cell Type’ were tested by adjusting the minimum diameter and the viable cell spot brightness and reanalyzing images at each of these potential settings. The sample volume was also varied to determine the optimal sample volume. A statistician determined the combination of Vi-CELL BLU instrument settings and sample volume that led to VCC and percent viability results that best matched the Vi-CELL XR instrument results across all sites and cell conditions, and those settings were selected as the final platform CHO Vi-CELL BLU ‘Cell Type’ (Table 1).
| Vi-CELL XR Analyzer | Vi-CELL BLU Analyzer | |
|---|---|---|
| Minimum diameter | 6 μm | 7 μm |
| Maximum diameter | 50 μm | 50 μm |
| Number of images | 50 | 50 |
| Aspirate cycles | 1 | 6 |
| Trypan Blue cycles | 3 | 4 |
| Cell brightness | 85% | N/A |
| Cell sharpness | 100% | 7% |
| Viable cell spot brightness | ||
| Viable cell spot area |
75% | 52% |
| Minimum circularity |
0 | 0 |
| Decluster degree |
Medium | High |
| Sample volume | 1.0 mL | 0.3 mL |
Table 1. The optimized ‘Cell Type’ settings for the Vi-CELL XR and Vi-CELL BLU instruments for platform CHO cell lines within GSK.
This optimized ‘Cell Type’ was used for the robustness study, which followed a similar experimental plan to optimization, but incorporated a wider range of samples to ensure that across a large sample pool the Vi-CELL BLU analyzer was not inferior to the Vi-CELL XR analyzer. Eight different CHO cell lines were used to supply a diverse sample set so that the results could be applied to all CHO cell lines within GSK. The CHO cell lines were split into three experiments, as described in Table 2, based on availability of the cell line at each location. One experiment focused specifically on testing the same asset across more than three sites, including development and manufacturing sites, to ensure robustness of eventual process transfers. Four sample categories were created, based on VCC and percent viability ranges of interest, to ensure roughly equal numbers of samples were obtained at high and low VCC and percent viability, to confirm that the Vi-CELL BLU instrument was suitable for all expected samples across the cell culture process (Table 3). During the seed train, the cells are expected to fall into the Low/ High or High/High categories, while during the production bioreactor the cells are expected to initially be in the Low/High or High/High categories, followed by the High/Low and Low/Low categories closer to harvest (see Table 3). After all the results were obtained, a statistical analysis was performed to evaluate differences between the two instruments by calculating the mean percent differences and comparing variability.
| Experiment | Purpose | Assets | Site |
|---|---|---|---|
| 1 | Evaluate instrument performance across multiple sites | A, B | Site 1, Site 2, Site 3, Site 4 |
| 2 | Evaluate instrument performance at a single site across multiple cell lines | C, E, H | Site 3 |
| 3 | Evaluate instrument performance at a second site across multiple cell lines | C, D, F, G, H | Site 2 |
Table 2. Descriptions of each experiment. Assets each represent a unique cell line selected to provide a comprehensive view of cell lines within GSK. The cross-site study required the asset to be available at a minimum of three of the participating sites.
| Category | Purpose | Assets |
|---|---|---|
| LL (Low/Low) | < 15 | < 90 |
| LH (Low/High) | < 15 | ≥ 90 |
| HL (High/Low) | ≥ 15 | < 90 |
| HH (High/High) | ≥ 15 | ≥ 90 |
Table 3. Sample categories. Sample categories were divided into expected VCC and percent viability ranges that occur throughout the cell culture process. The category labels were used to ensure a roughly equal number of samples from each category was obtained at each site to avoid statistical bias in the results.
The goal of the robustness study was to prove non-inferiority of the Vi-CELL BLU analyzer as compared to the Vi-CELL XR analyzer. Non-inferiority was selected as the goal as it is easier to statistically prove than superiority. The following conditions were required to be met to claim non-inferiority. First, the variability of the Vi-CELL BLU analyzer had to be less than the variability of the Vi-CELL XR analyzer, both between two instruments and within an individual instrument. Second, the bias between them for VCC and percent viability was considered acceptable if one of the following conditions were met:
- The overall bias between the Vi-CELL BLU and XR instruments was less than the Vi-CELL XR instrument’s
variability.
- The overall bias between the Vi-CELL BLU and XR instruments was larger than the Vi-CELL XR instrument’s
variability, but within what was considered acceptable to the stakeholders, which was determined to be <10%.
- The overall bias between the Vi-CELL BLU and Vi-CELL XR instruments was larger than the Vi-CELL XR instrument’s variability, and not within what is considered acceptable to stakeholders, and therefore a correction factor would be implemented—potentially requiring different correction factors based on the cell line used or the sample category.
Results
Experiment 1 consisted of a cross-site study of two CHO cell lines across at least three sites. All data was analyzed together and the overall mean percent difference for both VCC and percent viability within the instruments was calculated. The data was also visualized by breaking the mean percent difference down across various variables, in particular the experiment site, the cell line, and the category of VCC and percent viability to visualize the differences more clearly.
Overall, the mean percent difference in VCC between the Vi-CELL BLU and Vi-CELL XR instruments (4.5%) was larger than the mean percent difference between the two Vi-CELL XR instruments (1.0%) (Table 4). This suggests that there will be some variance in VCC measurement with changing from the Vi-CELL XR to the Vi-CELL BLU instrument, but as this variance is less than 10%, it was determined to be within a reasonable range and would have minimal impact on any processes. Based on the conservative estimate of mean percent different, which takes into account the 95% confidence limit for the measurements, the Vi-CELL BLU analyzer had better reproducibility for VCC than the Vi-CELL XR analyzer. For percent viability, the mean percent difference between the Vi-CELL BLU and Vi-CELL XR instruments (1.2%) was smaller than between two Vi-CELL XR instruments (1.9%). This suggests that the percent viability measurements on the Vi-CELL BLU instrument would be within the expected range of measurements expected between two Vi-CELL XR instruments. For percent viability, the reproducibility was also better between two Vi-CELL BLU instruments than between two Vi-CELL XR instruments based on the conservative estimate of the mean percent difference.
| Response | Comparison | Mean % Difference* | Conservative Estimate of Mean % Difference** |
|---|---|---|---|
VCC |
Vi-CELL BLU vs. Vi-CELL XR |
4.5% | 6.0% |
| Vi-CELL BLU 1 vs. Vi-CELL BLU 2 |
1.1% | 1.3% | |
| Vi-CELL XR1 vs. Vi-CELL XR 2 | 1.0% | 1.8% | |
| % Viability | Vi-CELL BLU vs. Vi-CELL XR | 1.2% | 1.6% |
| Vi-CELL BLU 1 vs. Vi-CELL BLU 2 | 0.6% | 0.8% | |
| Vi-CELL XR1 vs. Vi-CELL XR 2 | 1.9% | 2.5% |
Table 4. The overall variability between Vi-CELL analyzer types vs. within Vi-CELL analyzer types for experiment 1.
*The absolute value was used in the calculation of the Mean % Difference
** The 95% confidence limit was calculated to account for uncertainty in the mean estimate

Figure 2. Comparison of Mean % Difference for VCC of Asset A as separated by category and site. Note that not all sites had access to cells for each category, which is why some columns contain no data.

Figure 3. Comparison of Mean % Difference for percent viability of Asset A as separated by category and site. Note that not all sites had access to cells for each category, which is why some columns contain no data.
Figures 2 and 4 show comparisons in the mean percent difference of the VCC between the two instruments as broken down by category and site for the two cross-site assets, A and B. The mean percent difference is indicated by the red circle and is negative if the value for the Vi-CELL XR instrument is larger, and positive if the value of the Vi-CELL BLU instrument is larger. The error in the calculation is indicated by the blue bars representing the lower and upper confidence intervals. Note that some sites were not able to collect data in each category for some assets based on differences in upstream process, which results in the lack of data in some columns of the figures. The majority of the mean percent difference values are close to zero with a 95% confidence interval that crosses zero, which suggests no trends in percent viability between the two instrument types.
For many combinations of variables, the mean percent difference was close to zero. A few general trends were noticed, most notably that for VCC the Vi-CELL BLU instrument tends to measure lower than the Vi-CELL XR instrument, as there are more negative mean percent difference values than positive for both Assets A and B. The largest error is seen in the categories with low VCC values (LL and LH), which is likely partially mathematical, as the mean percent difference is artificially inflated because the calculation involves dividing smaller values. More of the Vi-CELL XR-Vi-CELL XR comparisons have a wider 95% confidence intervals when compared to the Vi-CELL BLU-Vi-CELL BLU comparisons, suggesting lack of repeatability at times between Vi-CELL XR instruments which is seen to a lesser extent between Vi-CELL BLU instruments.
Figures 3 and 5 present the mean percent difference in percent viability between the Vi-CELL XR and Vi-CELL BLU instruments as broken down by category and site. The majority of the mean percent difference values are close to zero with a 95% confidence interval that crosses zero. Larger differences were seen at lower viability, in the LL category for both assets, and to a smaller extent in the LH category for asset B.
The overall data in experiment 1, the cross-site robustness study, successfully demonstrated the non-inferiority of the Vi-CELL BLU over Vi-CELL XR instrument. The differences in both the VCC and percent viability between the two were either smaller than the differences between two Vi-CELL XR instruments or not practically significant. Also, the Vi-CELL BLU analyzer was found to have less instrument-to-instrument variability than the Vi-CELL XR analyzer.

Figure 4. Comparison of Mean % Difference for VCC of Asset B as separated by category and site. Note that not all sites had access to cells for each category, which is why some columns contain no data.

Figure 5. Comparison of Mean % Difference for percent viability of Asset B as separated by category and site. Note that not all sites had access to cells for each category.
Experiment 2 utilized three CHO cell lines within one site to test reproducibility across multiple cell lines of interest at a single site. For both VCC and percent viability, the mean percent difference between the two Vi- CELL XR instruments was larger than the difference between either two Vi-CELL BLU instruments (Table 5). The conservative estimate of the mean percent difference was also largest for the Vi-CELL XR-Vi-CELL XR instrument comparison, indicating better reproducibility between Vi-CELL BLU instruments than Vi-CELL XR instruments. This demonstrates that the Vi-CELL BLU analyzer is non-inferior to the Vi-CELL XR analyzer.
The 95% confidence interval for mean percent difference in VCC between the Vi-CELL BLU and the Vi-CELL XR instrument was largest for the LH category of low VCC and high percent viability for all three assets tested (Figure 6) and the mean percent difference was around -20%. This indicates that for this category of cells, the Vi-CELL BLU instrument may count lower than the Vi-CELL XR instrument, though again the error is expected to be partially mathematical, as dividing small numbers will lead to larger percent errors. It is noted as well that in experiment 2, this category had the least number of samples, which also might explain the larger variability. For the percent viability for experiment 2, the mean percent differences were close to zero for most samples, but slightly low for one asset, Asset C, at low viability (Figure 7).
| Response | Comparison | Mean % Difference* | Conservative Estimate of Mean % Difference** |
|---|---|---|---|
VCC |
Vi-CELL BLU vs. Vi-CELL XR |
2.8% | 5.6% |
| Vi-CELL BLU 1 vs. Vi-CELL BLU 2 |
1.6% | 2.9% | |
| Vi-CELL XR1 vs. Vi-CELL XR 2 | 14.2% | 17.5% | |
| % Viability | Vi-CELL BLU vs. Vi-CELL XR | 2.0% | 2.8% |
| Vi-CELL BLU 1 vs. Vi-CELL BLU 2 | 1.5% | 2.3% | |
| Vi-CELL XR1 vs. Vi-CELL XR 2 | 4.5% | 5.5% |
Table 5. Overall instrument comparison for experiment 2.
*The absolute value was used in the calculation of the Mean % Difference
** The 95% confidence limit was calculated to account for uncertainty in the mean estimate.

Figure 6. Comparison of Mean % Difference for VCC for experiment 2 comparing the Vi-CELL XR and Vi- CELL BLU instruments as separated by category and asset. Note that not all cell lines had a process that led to a sufficient number of samples in each VCC and percent viability category, which is why some columns contain no data.
Comparison of Mean % Difference for VCC for experiment 2 comparing the Vi-CELL XR and Vi-CELL BLU instruments as separated by category and asset. Note that all not cell lines are had a process that led to a sufficient number of samples in each VCC and percent viability category, which is why some columns contain no data.

Figure 7. Comparison of Mean % Difference for percent viability for experiment 2 as separated by category and asset. Note that not all cell lines had a process that led to a sufficient number of samples in each VCC and percent viability category, which is why some columns contain no data.
Based on the analysis of the provided data for CHO cell lines tested at this site, use of Vi-CELL BLU analyzer in place of Vi-CELL XR analyzer was determined to be acceptable with minimal or no impact on the viable cell count and percent viability measurements or the subsequent process.
Experiment 3 utilized four CHO cell lines within a second site to test reproducibility across multiple cell lines of interest at a different single site. For both VCC and percent viability, the mean percent difference is larger between the two Vi-CELL XR instruments tested than between the Vi-CELL BLU and Vi-CELL XR instruments (Table 6). The mean percent difference between two Vi-CELL BLU instruments is the smallest for both VCC and percent viability, suggesting that there is better precision between them than the Vi-CELL XR instruments.
| Response | Comparison | Mean % Difference* | Conservative Estimate of Mean % Difference** |
|---|---|---|---|
VCC |
Vi-CELL BLU vs. Vi-CELL XR |
5.8% | 7.4% |
| Vi-CELL BLU 1 vs. Vi-CELL BLU 2 |
0.6% | 1.5% | |
| Vi-CELL XR1 vs. Vi-CELL XR 2 | 6.9% | 9.0% | |
| % Viability | Vi-CELL BLU vs. Vi-CELL XR | 2.1% | 2.6% |
| Vi-CELL BLU 1 vs. Vi-CELL BLU 2 | 0.1% | 0.2% | |
| Vi-CELL XR1 vs. Vi-CELL XR 2 | 2.9% | 3.5% |
Table 6. Overall instrument comparison for experiment 3.
*The absolute value was used in the calculation of the Mean % Difference
** The 95% confidence limit was calculated to account for uncertainty in the mean estimate.
Each asset does show some different ranges in the mean percent difference of the VCC between the two instruments as broken down by category (Figure 8). The overall trend seen in experiment 3 was a slightly lower VCC on the Vi-CELL BLU than the Vi-CELL XR instrument when the viability was high for all assets, coupled with an equivalent or slightly higher VCC when the percent viability was low for all assets. At low percent viability, there appears to be some asset-specific differences in the difference in VCC measurements between the two instruments.
Figure 8. Comparison of Mean % Difference for VCC for experiment 3 as separated by category and asset.
The mean percent difference in percent viabilities followed a similar trend. Overall, the viability for the Vi-CELL BLU analyzer was slightly higher than for the Vi-CELL XR analyzer (Figure 9). This slightly positive difference does seem to apply regardless of category, though the difference was smaller when the viability was high than at low viabilities. At low viability, there does seem to be some cell line-specific trends, which was in line with the differences seen in VCC measurements at low viability.

Figure 9. Comparison of Mean % Difference for percent viability for experiment 3 as separated by category and asset.
Based on the analysis of the provided data, the conclusion of experiment 3 is that changing from the Vi-CELL XR to the Vi-CELL BLU analyzer for the CHO cell lines tested should not have a practically significant impact on VCC and percent viability measurements.
Conclusion
The Vi-CELL BLU analyzer was demonstrated to be non-inferior to the Vi-CELL XR analyzer across a wide range of CHO cell lines at various VCC and percent viability conditions across all three experiments. The data also demonstrated that the precision of the Vi-CELL BLU analyzer was higher than that of the Vi-CELL XR analyzer, which would potentially reduce variability in cell counting between instruments. Along with this data, the other benefits of the Vi-CELL BLU analyzer were considered, including lower sample volume requirement, faster sample throughput, wider range of use prior to dilution and improved safety features. Together, this led to the decision to select the Vi-CELL BLU analyzer to replace the Vi-CELL XR analyzer across GSK biopharmaceutical development and manufacturing.
A key feature of this project was the stage-wise progression of the project from feasibility to robustness evaluation that started with identification of key stakeholders, collection of user requirements and optimization of the Vi-CELL BLU analyzer parameters across multiple sites. An inclusive project delivery approach with representation across statistics, research, development, technology, engineering, and manufacturing also contributed to this project’s success. Notably, it was important to include multiple sites and assets when performing these optimization and robustness studies, as there were some differences noted between different sites and different assets tested, though the overall non-inferiority outcome was replicated across all sites and assets.
The projects’ planning phase, multi-site execution phase and endorsement were conducted in a one-year timeframe. The successful project management framework utilized for planning/execution was based on good project management practice, and the following seven principles were utilized:
- Established a statistician as a core team member from the onset of project
- Established a good working relationship with the vendor
- Had both a portfolio view as well as a project view for implementation
- Used project management principles, including developing a team charter, identifying key stakeholders and managing user requirements
- Had an inclusive mindset when setting up a core team that reflected the voices of key stakeholders
- Used a framework for the technology readiness level assessment that led from feasibility to optimization to robustness to implementation to industrialization
- Were practical and open-minded with regards to establishment of success criteria, in this case the use of non-inferiority.

