Analysis of plant genome sizes using flow cytometry: a case study demonstrating dynamic range and measurement linearity
David Galbraith Ph.D.1, Elizabeth Villalobos-Menuey2
1School of Plant Sciences and Bio5 Institute, University of Arizona, Tucson, Arizona, USA
2Beckman Coulter USA Corresponding Author Email Address: galbraith arizona.edu
Plant Flow Cytometry

Flow cytometers were originally designed to operate with suspensions of cells, prototypically blood cells, and most applications still involve samples of this type. Despite the fact that plant cells and their protoplasts are generally larger than mammalian blood cells, these cells can still be analyzed by flow cytometry. At most growth stages, higher plants are comprised of tissues and organs, complex three-dimensional assemblies of cells held together by cell walls. Consequently, prior to analysis, plants must be first processed to produce cellular suspensions that are compatible with flow cytometry. One approach is to dissolve the cell walls, using enzymes that hydrolyze their carbohydrate components, to release protoplasts, which then can be readily analyzed on the cytometer.
The second approach, detailed here with the CytoFLEX, involves analysis not of protoplasts, but of suspensions of nuclei released from plant tissues and organs via a simple chopping procedure (2). The procedure involves cutting open the cells within the tissues using a standard double-edged razor blade. The homogenate is clarified using a nylon mesh filter through which the released nuclei are passed. The nuclei are then stained with DNA-specific fluorochromes, which allows flow cytometric determination of the DNA content of the individual nuclei. Interest in measurement of plant genome sizes derives from the observation that higher plants, when analyzed across species, display an extraordinarily large range of genome sizes: a current lower limit of around 0.13 pg per 2C nucleus for Genlisea margaretae to an upper limit of 304.40 pg for Paris japonica (3). The latter genome is roughly 50 times larger than the human genome, and the DNA from a single cell of Paris japonica, when stretched out, would extend approximately 91 meters.
Flow cytometry coupled with the chopping procedure provides a simple means of determining genome sizes that is generally applicable across species and the methodology has been widely adopted across the globe to address numerous problems in basic and applied biology, ecology, and agriculture. This includes applications in biotechnology, such as monitoring genetic stability following transformation and tissue culture, prioritizing species for whole genome sequencing, validating the completeness of whole genome assemblies, and providing appropriate planning for genetic engineering procedures such as DNA library production. Applications in agriculture that benefit from flow cytometry include production of haploid and dihaploid lines using anther/ovary culture, followed by colchicine doubling, production of seed-sterile triploid lines, production of plants having tetraploid and higher ploidy levels, associated with desired traits such as fruit size, quality control of euploidy status for commercial seed lots, identification of individuals having novel ploidy levels and displaying novel modes of reproduction (including apomixis), characterization of interspecific hybridization based on intermediate nuclear DNA contents, classification of ploidy distributions within germplasm collections, sex determination in dioecious plants, and identification of hybrids formed between wild species, and between wild and cultivated species.
Applications in plant anatomy, cell biology, physiology, and development that benefit from flow cytometry include the study of the regulation of the cell division cycle and of endoreduplication in plant development, and the effects of abiotic and biotic stress on these processes. Flow cytometry has also led to widespread investigations into the concept of the nucleotype, i.e. the phenotypic effect of the amount of the nuclear DNA, independent of its encoded informational content, on nuclear volume, the proportions of the nucleus occupied by chromosomes, the durations of mitosis and meiosis, seed size, and the minimum generation time. Flow cytometry is also useful for detection of mixoploidy and chimerism. Analysis of gene expression as a function of cell type, using flow sorted nuclei, is increasingly recognized as an important field of research. In taxonomy and systematics, flow cytometry is invaluable in screening for modes of reproduction, identification of speciation and reproductive isolation, description of population dynamics in hybrid zones, discovery of new cytotypes and of cytotype structure over large-scale populations, detection and delimitation of plant species for biodiversity and conservation, studies of the mechanisms of plant genome evolution focusing on the causes and consequences of nuclear DNA content variation, and information on evolution coming from studying nuclear DNA contents across phylogenies. Large-scale comparative analyses of genome size also can be used to study correlations between genome size and environmental factors, between genome size and seed mass, between genome size and species richness across different plant groups, with the suggestion that species having large genomes may be more susceptible to extinction, between genome size and invasive potential, and between ecological niche and minimal genome size (particularly carnivorous plants).
As a consequence of the rapidly increasing level of interest in flow cytometric analyses of this type, and the increasingly large numbers of species for which data is being published, searchable repositories have emerged as a valuable resource for assignment of DNA contents to genome sizes, through providing calibration relationships, with consensus being approached in a crowd-sourced manner. One of the most important of these resources is the Kew C-value database, which is curated by experts, and provides nuclear DNA content values as a function of genus and species, in searchable form via the internet (3). Curators also define “Gold-standard” nuclear DNA content values, which are believed to be more accurate and reproducible (3). Overall, flow cytometric estimates of nuclear DNA contents are comparable to the sizes of assemblies from whole genome sequencing, although the presence of highly-repetitive chromosomal DNA typically leads to lower genome size estimates obtained from sequence-based approaches. Various factors that have the potential to confound flow cytometric calibration have been identified and can be avoided. For example, the binding and resultant fluorescence of some DNA-specific fluorochromes is base-pair specific, and therefore not a true measure of DNA amount across species having nuclear genomes with different AT: GC ratios.
In this protocol, we employ propidium iodide (PI) as the DNA fluorochrome. In the presence of ribonuclease to eliminate contributions to fluorescence by double-stranded RNA, PI intercalates the DNA double-helix, producing intense fluorescence having an excitation maximum at around 535 nm and an emission maximum at 617 nm. The emission profile is relatively broad having a 50% maximal spectral width spanning approximately 100 nm (590-690 nm).
PI was used to assess the DNA content of four species: Arabidopsis thaliana (thale cress) Solanum lycopersicum (tomato), Zea mays (maize) and Capsicum annuum (pepper). The organs used to prepare the Arabidopsis and Capsicum samples illustrate the interesting phenomenon of endoreduplication, in which somatic cells enter into successive rounds of genome replication (S-phase) without an intervening mitosis (4). This endocyclic process results in polyploidy, which is common in plants (7).

Figure. Flow cytometry Effectively Measures Endoreplication in Plant Cells. The right image depicts various types of mitotic gene replication during the cell cycle. These events result in polyploid tissues. On the left the workflow for preparing plant tissues by flow cytometry is depicted including the data indicating the results of mitotic endocycling.
TIPS FOR SUCCESS
- For optimal homogenization, conduct the entire process in a walk-in cold room.
- Use of sharp blades at ALL times is key in excision of nuclei with minimal disruption of their structure. Blades should be used on no more than five samples.
- Do not over-chop the samples. Sufficient nuclei should be released within 60 seconds of starting homogenization. Continuing the process much beyond minute will damage the nuclei.
- Be prepared to evaluate different homogenization buffers and additives in order to handle species that appear recalcitrant. Avoid browning of samples, and/or the appearance of mucilages or other polymeric materials in the homogenates.
- Select freshly-harvested, young tissues that are actively growing, seedlings are ideal.
PROTOCOL
|
Reagents and Supplies |
Supplier |
Part Number |
|
Propidium iodide |
ThermoFisher |
P1304MP |
|
Ribonuclease A |
Sigma Aldrich |
R6513 |
|
Razor Blades (Feather Hi-Stainless Blades Double Edge, or similar) |
Amazon |
|
|
Partec 30 µm Filters (green) |
Fisher Scientific |
NC9754599 |
|
Sterile 60 × 15 mm disposable plastic petri dishes |
Fisher Scientific |
FB0875713A |
|
All remaining chemicals |
Reagent-grade from any commercial chemical supply house |
SAMPLE PREPARATION
- Prepare chopping buffer (2): 45 mM MgCl2, 30 mM sodium citrate, 20 mM MES, pH 7.0 adjusted with NaOH. Filter sterilize and store as 50 mL aliquots at −20 °C. Can be stored at 4 °C after thawing if not completely used.
- Prepare the Propidium iodide (PI) stock solution: 1 mg/mL in deionized water (diH2O). Store as 1 mL aliquots at −20 °C. Once thawed, the solution is stable at room temperature if protected from light.
- Prepare a DNAase-free ribonuclease (RNAase) A stock solution: 10 mg/mL in diH2O. Store as 1 mL aliquots at −20 °C until the day of use. Refreeze remainder of aliquot after use.
- Isolate plant nuclei as follows:
- For nuclear staining, add 500 μL of the filtered homogenates to labeled tubes. Add 2.5 μL of RNAase (10 mg/mL). Incubate on ice for 10 min. Add PI to a final concentration of 50 μg/mL. Analyze immediately using the CytoFLEX.
CYTOFLEX INSTRUMENT PREPARATION
|
Reagents and Supplies |
Supplier |
Part Number |
|
CytoFLEX Daily Quality Control Fluorospheres |
Beckman Coulter |
B53230 |
|
CytoFLEX Sheath Fluid |
Beckman Coulter |
B51503 |
| Contrad 70 Cleaning Solution |
Beckman Coulter |
81911 |
|
FlowClean Cleaning Agent |
Beckman Coulter |
A64669 |
- Run the CytoFLEX System Startup Program.
- Verify the detector configuration.
- Run the Quality Control procedure according to the user manual: “CytoFLEX Series Instructions for Use”, document number B49006
The results shown in this application sheet were generated on the Beckman Coulter CytoFLEX S Flow Cytometer with the following laser and filter configuration (Figure 1):
- 405 nm, 80 mW solid-state diode laser.
- 488 nm, 50 mW solid-state diode laser.
- 561 nm, 30 mW solid-state diode laser.
- 638 nm, 50 mW solid-state diode laser.
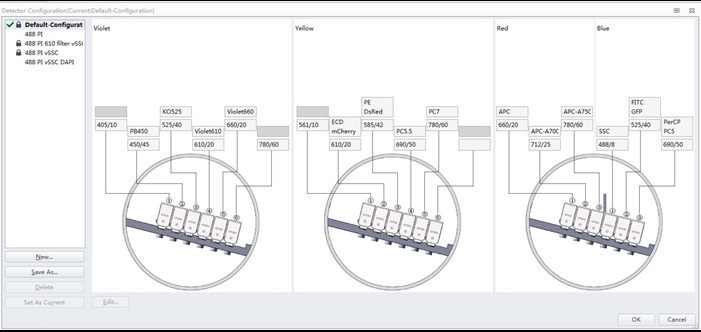
Figure 1. Standard filter configuration of a 4 laser/13 channel CytoFLEX S flow cytometer
It should be noted that the results require acquisition using only the blue (488 nm) laser and a single fluorescence channel (in this case, labeled PerCP PC5) that collects light centered at 690 nm with a 50 nm spectral bandwidth.
CREATING AN EXPERIMENT
- Open the “New Experiment” dialog box in the File menu (Figure 2).
- Choose a location for the experiment file.
- Open the Detector Configuration window and verify that software (SW) and hardware (HW) configurations match.
- Under the Settings tab, select “Set Channel” and de-select the channels not in use. This is allowed since we only require excitation from one laser, and detection only from light scatter and the one-color fluorescence (PerCP) channel (Figure 3).
-
Open the “Acq. Settings” window.
- Select the “Gain” tab. Adjust the gain settings to correspond to those of Figure 4:
- Select the “Threshold” tab. Adjust the settings to correspond to those of Figure 5.
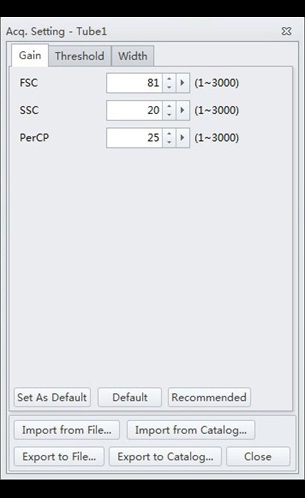
Figure 4. CytExpert Acq. Settings Gain submenu options.
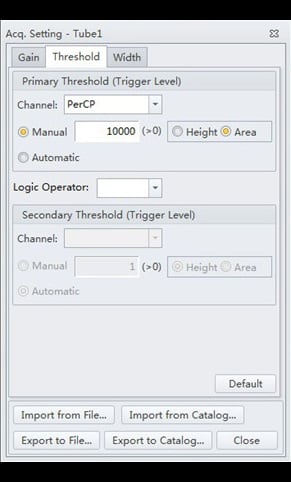
Figure 5. CytExpert Acq. Settings Threshold submenu options.
These threshold settings are somewhat atypical. First, triggering is done on the PerCP fluorescence channel, rather than on FS or SS as would be done for cell suspensions. This is because the population of interest (the PI-stained nuclei) make up a very tiny proportion of the suspension of objects passing through the flow cytometer, which predominantly comprises debris and cellular organelles. Utilizing fluorescence as a trigger eliminates all light-scattering non-fluorescent objects from detection. Further discrimination is achieved by adjusting upwards the threshold level to exclude all objects of lesser fluorescence than the PI-stained nuclei. This threshold level is a function of the gain setting chosen for the PerCP channel, and the size of the genome being analyzed, but the suggested values (Figures 4 and 5) should be generally applicable as long as the instrument QC protocol is followed on start-up.
- Close the “Threshold tab”. Create one single parameter histogram and two bivariate dot plots in the experiment space.
- The first bivariate dot plot will be labeled as PerCP channel versus Side Scatter, with the following properties: A polygonal gate (P1) is drawn as indicated in Figure 6:
- The single parameter histogram is of the PerCP-A channel versus Count, gated on P1, with the following properties (Figure 8):
- Add a statistics panel, by clicking on the statistics tab on the acquisition page, and customize this panel by right-clicking on it to reveal the Statistics Settings (Figure 9). The display can be considerably simplified since we are interested only in the statistical properties of the PI fluorescence (PerCP channel).
- Initiate acquisition using the settings of Figure 10. Using the slow flow rate setting provides the lowest peak CVs. Acquisition is completed well defined populations of nuclei that maintain a consistent fluorescent signal over time are observed. Operationally, this can be defined as when the height of the highest uniparametric peak reaches a preset value (200 is reasonable; going beyond this number provides no significant advantage, and simply serves to slow down overall sample processing rates). The gating is adjusted after accumulation to optimize the peak profiles.


Figure 6. The first bivariate plot (left) and associated plot properties (right).
The second bivariate plot is of the PerCP-A channel versus Time, with the following properties. A rectangular gate (P7) is drawn as shown in Figure 7:


Figure 7. The second bivariate plot (left) and associated plot properties (right).
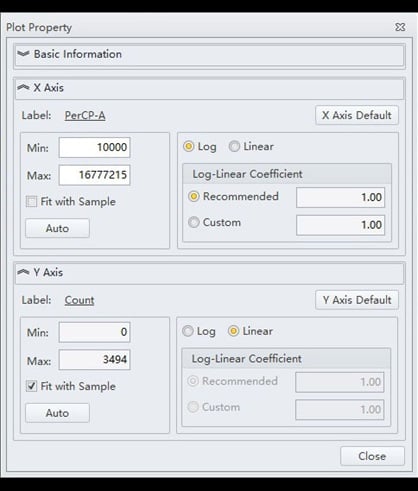
Figure 8. The CytExpert settings associated with the single parameter histogram.
After acquisition is completed, linear regions will be positioned around the various populations (2C, 4C, etc.) of nuclei, to provide information concerning the amounts of fluorescence and the degree of dispersion (CV) associated with each peak.

Figure 9. CytExpert Acquisition pane Statistics submenu options.
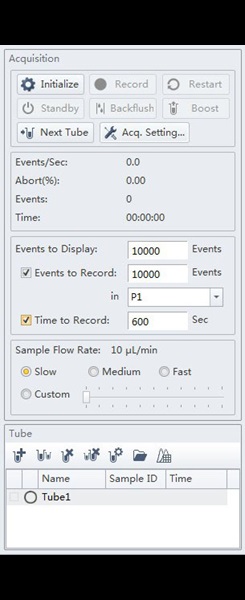
Figure 10. CytExpert Acquisition submenu options
Accessing the Kew C-Value Database
This database is a compendium of nuclear DNA content values pulled from the scientific literature, maintained by scientists at the Royal Botanical Gardens at Kew. It is regularly updated, is accessible free of charge, and can be searched according to binomial descriptors. Customizable output formats are available.
- Access the Kew Plant C-values database. (http://data.kew.org/cvalues/CvalServlet?querytype=1.
- Complete the form, in the manner indicated for pepper in Figure 11, entering the binomial appropriate for the plant being analyzed.
- Click on the “Run Query” link. The results appear in the format of Figure 12.

Figure 11. Completing the input fields for a Kew C-value database query.

Figure 12. Kew C-value results returned for Capsicum annuum L. (pepper).
Results
We analyzed four different plant species. One (Arabidopsis thaliana (thale cress)) is notable for its small genome, whereas those of the other three species, Solanum lycopersicum (tomato), Zea mays (maize), and Capsicum annuum (pepper), are larger. The organs used to prepare the Arabidopsis and pepper samples illustrate the interesting phenomenon of endoreduplication, in which somatic cells enter into successive rounds of genome replication (S-phase) without an intervening mitosis (4). For arabidopsis, endoreduplication is found in most somatic tissues, whereas in pepper it is restricted to the fruit (5). An exact doubling of the genome is seen for each endoreduplication. In this way, somatic cells contain individual 2C, 4C, 8C, 16C, etc., nuclei. The extensive level of endoreduplication in pepper (nuclei of up to 32C can be readily detected) means that in these simple experiments, we span a dynamic range of 0.32pg to 101.32pg in DNA content, a factor of about 316-fold (Table 1).
| Binomial |
Common name |
Kew 2C DNA content (pg) |
Organ | |
|
Used |
Notes |
|
||
|
Arabidopsis thaliana L. |
Thale Cress |
0.32 |
Leaf | Ecotype Col-0 |
| Solanum lycopersicum |
Tomato |
2.05 |
Leaf |
|
|
Zea mays var. B73 |
Maize |
5.45 |
Leaf |
Inbred Line B73 |
| Capsicum annuum L. |
Pepper |
6.32 | Pericarp |
Table 1. Details of the plant species that were analyzed.
For Arabidopsis thaliana, the triad of gate-optimized parametric distributions appears as shown in Figure 13:

Figure 13. Flow analysis of PI-stained nuclei from Arabidopsis homogenates.
The bivariate scatter plot of SSC versus PI fluorescence (left panel) contains a large number of events, within which the nuclei occupy a well-defined series of regions, equally spaced in terms of fluorescence and corresponding to 2C, 4C, 8C, and 16C nuclei. There is also evidence of a slight population of 32C nuclei. Gating on region P1 is used to eliminate much of the non-nuclear debris, and allows an analysis of the stability of DNA fluorescence as a function of time after staining (center panel). The rectangular gate P2 identifies the point at which nuclear staining has stabilized, and this provides (right panel) a uniparametric display of the well-defined peaks of fluorescence representing the 2C, 4C, 8C and 16C nuclei. Linear regions (P2-P5) are then positioned across these peaks, such that they span the points at which the count of nuclei is 50% of the peak value. This provides the mean area value of the PI fluorescence, as well as the half-peak CV.
For tomato, the corresponding distributions are found in Figure 14:

Figure 14. Flow analysis of PI-stained nuclei from tomato homogenates.
The vast majority of the nuclei correspond to a 2C and 4C DNA content, implying operation of a conventional (non-endoreduplicative) cell division cycle.
For maize (Figure 15) the situation is the same as for tomato, the majority of the nuclei being 2C and 4C. There is also a small population of 8C DNA content observed in this species.

Figure 15. Flow analysis of PI-stained nuclei from maize homogenates.
Finally, for pepper fruit pericarp (Figure 16), a complex pattern of endoreduplication is seen.

Figure 16. Flow analysis of PI-stained nuclei from pepper homogenates.
At least five peaks of fluorescent nuclei are observed. It is possible further peaks might be located off-scale, but reduction of the gain, or a reconfiguration of the filters to decrease PI fluorescence emission, would be required to reveal these.
From these plots, the following summary data can be extracted (Table 2):
|
Species and C-value |
Region Identifier |
PI (A) Fluorescence |
CV |
Kew DNA Content (pg) |
|
2C arabidopsis |
P2 | 36441.4 |
1.77% |
0.32 |
|
4C arabidopsis |
P3 | 73232.3 |
1.68% |
0.64 |
|
8C arabidopsis |
P4 | 146529.5 |
1.39% |
1.28 |
|
16C arabidopsis |
P5 | 292808.0 |
1.32% |
2.56 |
| G2 tomato | P4 | 227905.5 |
1.28% |
2.05 |
|
G2 tomato |
P5 | 454325.5 |
1.32% | 4.1 |
| G1 maize | P4 | 610085.4 | 1.31% | 5.45 |
| G2 maize | P5 | 1194268.4 |
1.27% | 10.9 |
| 2C pepper | P2 | 839660.4 |
1.83% |
10.9 |
| 4C pepper | P3 | 1662447.6 | 1.64% | 12.64 |
| 8C pepper | P4 | 3298161.5 |
0.83% |
25.28 |
| 16C pepper | P5 | 6490372.5 |
1.81% |
50.56 |
| 32C pepper | P6 | 12746904.0 | 1.19% |
101.12 |
Table 2. Summary data from the dataset related to PI fluorescence, CV, and known DNA content values.
The first observation is that the individual nuclear peaks have consistently low CV values, all being less than 2%. In terms of the published literature, these CVs are remarkably low, and presumably reflect a lower level of instrument-derived variability as compared to other cytometers tested using the same species, the same sampled organs, and the same fluorochrome (see for example, reference 6).
The second observation is one of remarkable linearity of measurement across the dynamic range provided by the nuclei of the different plant species. This is illustrated in Figure 17, in which the nuclear DNA content values found in the Kew C-value database is plotted as a function of the mean fluorescence values for the various nuclear peaks for all species.
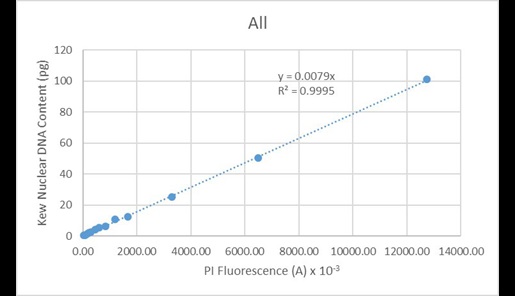
Figure 17. Regression analysis of known nuclear DNA content values versus PI fluorescence for all species and C-value categories.
These values are very highly correlated (R2 = 0.9995). Since the line of best fit is constrained to pass through the origin, this indicates the instrument has minimal systematic issues associated with baseline offset. A similar correlation is observed when regressing the data solely from Arabidopsis (Figure 18):
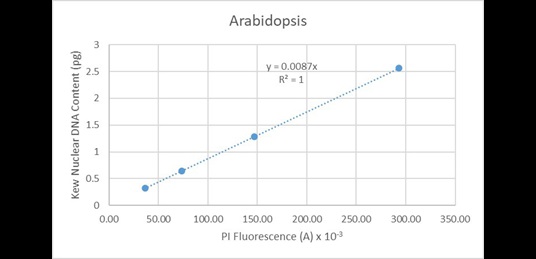
Figure 18. Regression analysis of known nuclear DNA content values versus PI fluorescence for all C-value categories of Arabidopsis
And from tomato and maize combined (Figure 19):
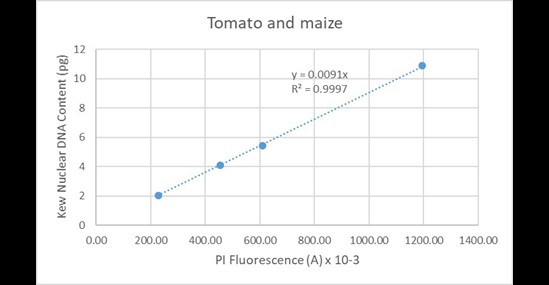
Figure 19. Regression analysis of known nuclear DNA content values versus PI fluorescence for all C-value categories for tomato and maize.
The same situation is seen when finally considering the data obtained solely from pepper (Figure 20):
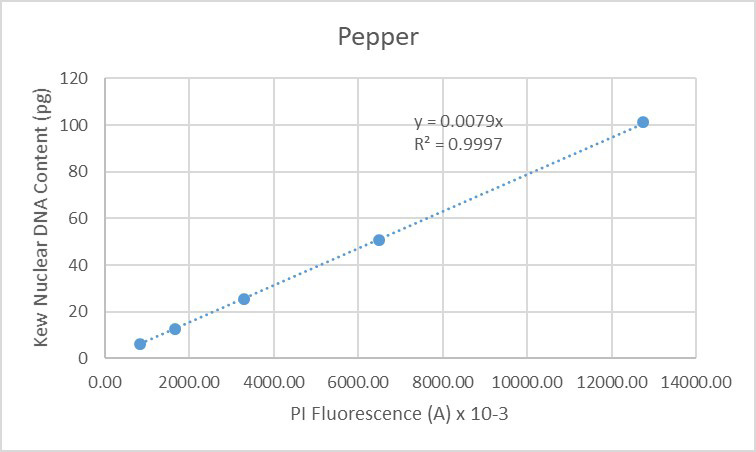
Figure 20. Regression analysis of known nuclear DNA content values versus PI fluorescence for all C-value categories for pepper.
Conclusion
The data presented here indicate the high degree of accuracy (low CVs) and linearity (r-squared values close to 1) of data generated by the CytoFLEX when used for genome size measurements in plants. Our assumption is that this derives from improved stability of the light sources and from improvements in detector performance. We conclude the CytoFLEX is highly suited for flow cytometric measurement of plant genome sizes. Further conclusions include that endoreduplication involves perfect multiplication of the genome as detectable using this technology, based on the data seen both for arabidopsis and pepper. Finally, is that the nuclear DNA content values compiled in the Kew database appear to be an accurate representation of the true genome sizes of the various species. If this were not so, deviation would be seen for the values of individual species from the overall lines of regression in Figures 17-20.
References
- Harkins, K.R., and Galbraith, D.W. (1987). Factors governing the flow cytometric analysis and sorting of large biological particles. Cytometry 8(1):60-71.
- Galbraith DW, Harkins KR, Maddox JM, Ayres NM, Sharma DP, Firoozabady E (1983) Rapid flow cytometric analysis of the cell cycle in intact plant tissues. Science 220(4601):1049-1051.
- Kew C-value Database: http://data.kew.org/cvalues/
- Galbraith DW, Harkins KR, Knapp S (1991). Systemic endopolyploidy in Arabidopsis thaliana. Plant Physiology 96(3):985-989.
- Galbraith DW (2014). Endoreduplicative standards for calibration of flow cytometric C-value measurements. Cytometry 85A(4):368-374.
- Galbraith DW (2009). Simultaneous flow cytometric quantification of plant nuclear DNA contents over the full range of described angiosperm 2C values. Cytometry 75A(8):692-698.
- Bruce A. Edgar, Norman Zielke & Crisanto Gutierrez, in Nature Reviews Molecular Cell Biology volume 15, pages 197–210 (2014) doi:10.1038/nrm3756
